Alaskan Catch of BC Salmon
Summary
Southeast Alaska Catch of BC Salmon
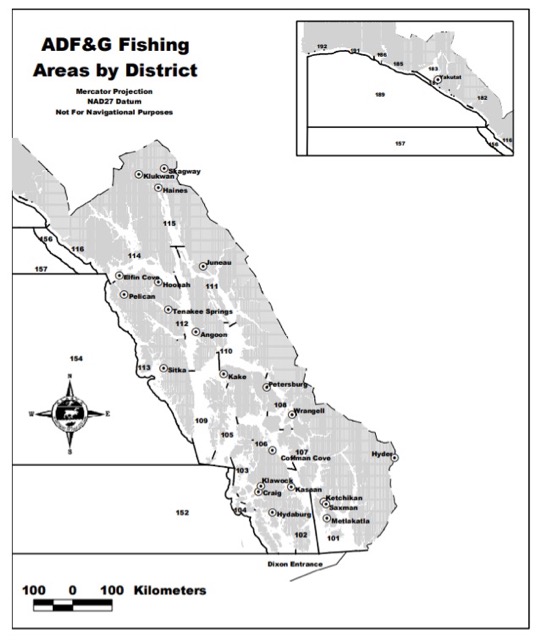
Figure 1 shows Southeast Alaskan fisheries management areas. Note the location of the District 104 (Noyes and Dall Island) and District 101 (Tree Point) areas.
Total catch of all species in SEAK commercial fisheries has ranged from ~70 million to ~260 million between 1985 and 2024 (Figure 2). Pink salmon dominate catch numbers. Chum and sockeye are the second most caught, followed by coho and finally Chinook salmon.
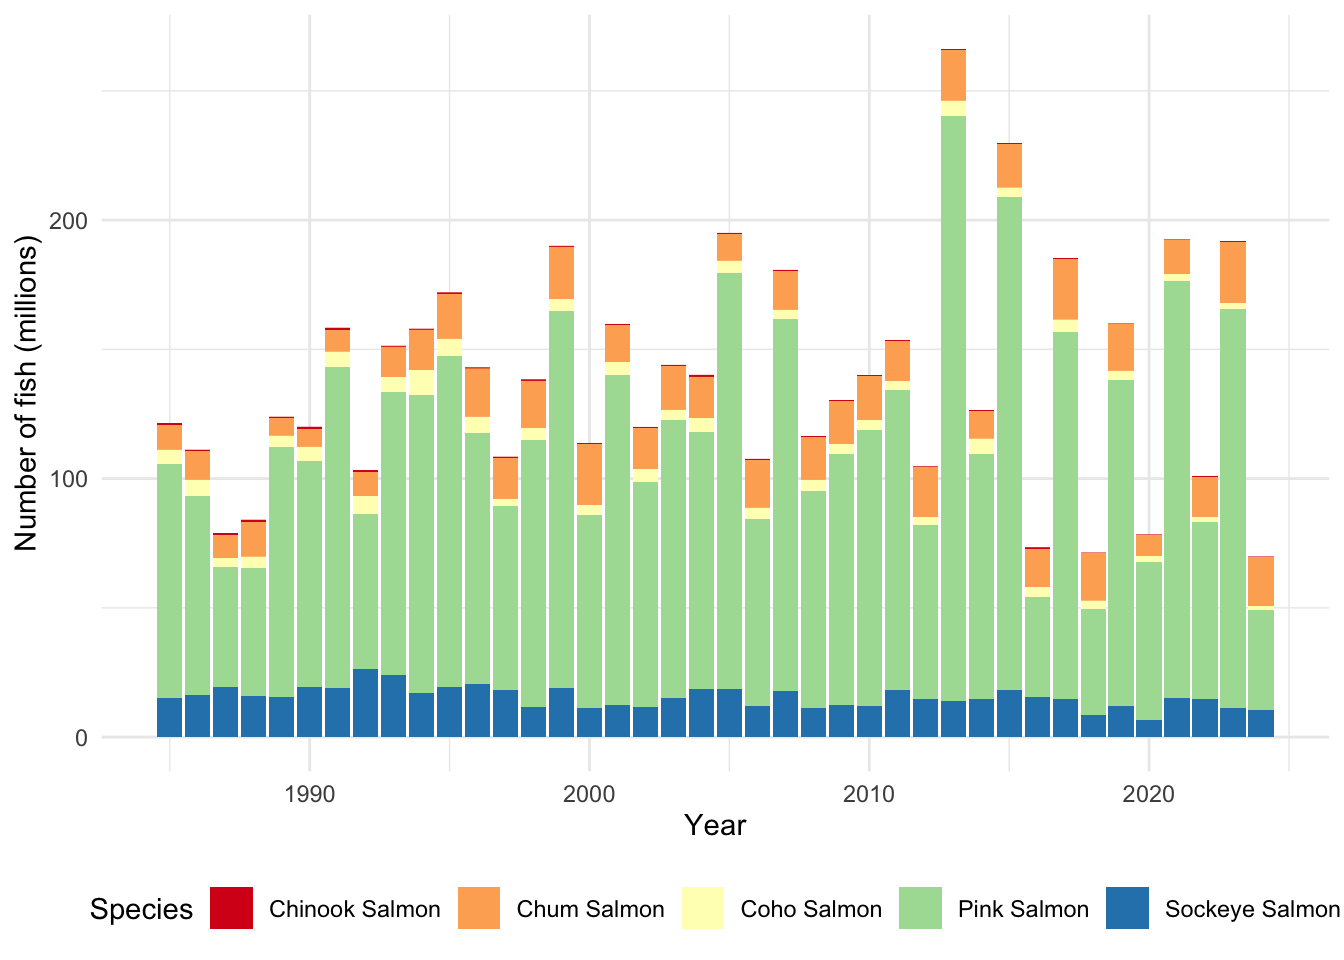
Figure 3 shows the harvest and harvest value of all salmon species in SEAK from 1979-2023. Chum salmon catch increased dramatically in the early 1990s. Catches of Chinook and coho salmon are trending down in recent years. Pink salmon catch is highly variable, with a discernable odd year/even year pattern (odd years being higher). Sockeye catches peaked in the mid-90s and have trended down since. Value is influenced by both the number of fish caught and the price per pound in any given year. Chum salmon now contribute the most value in SEAK fisheries.
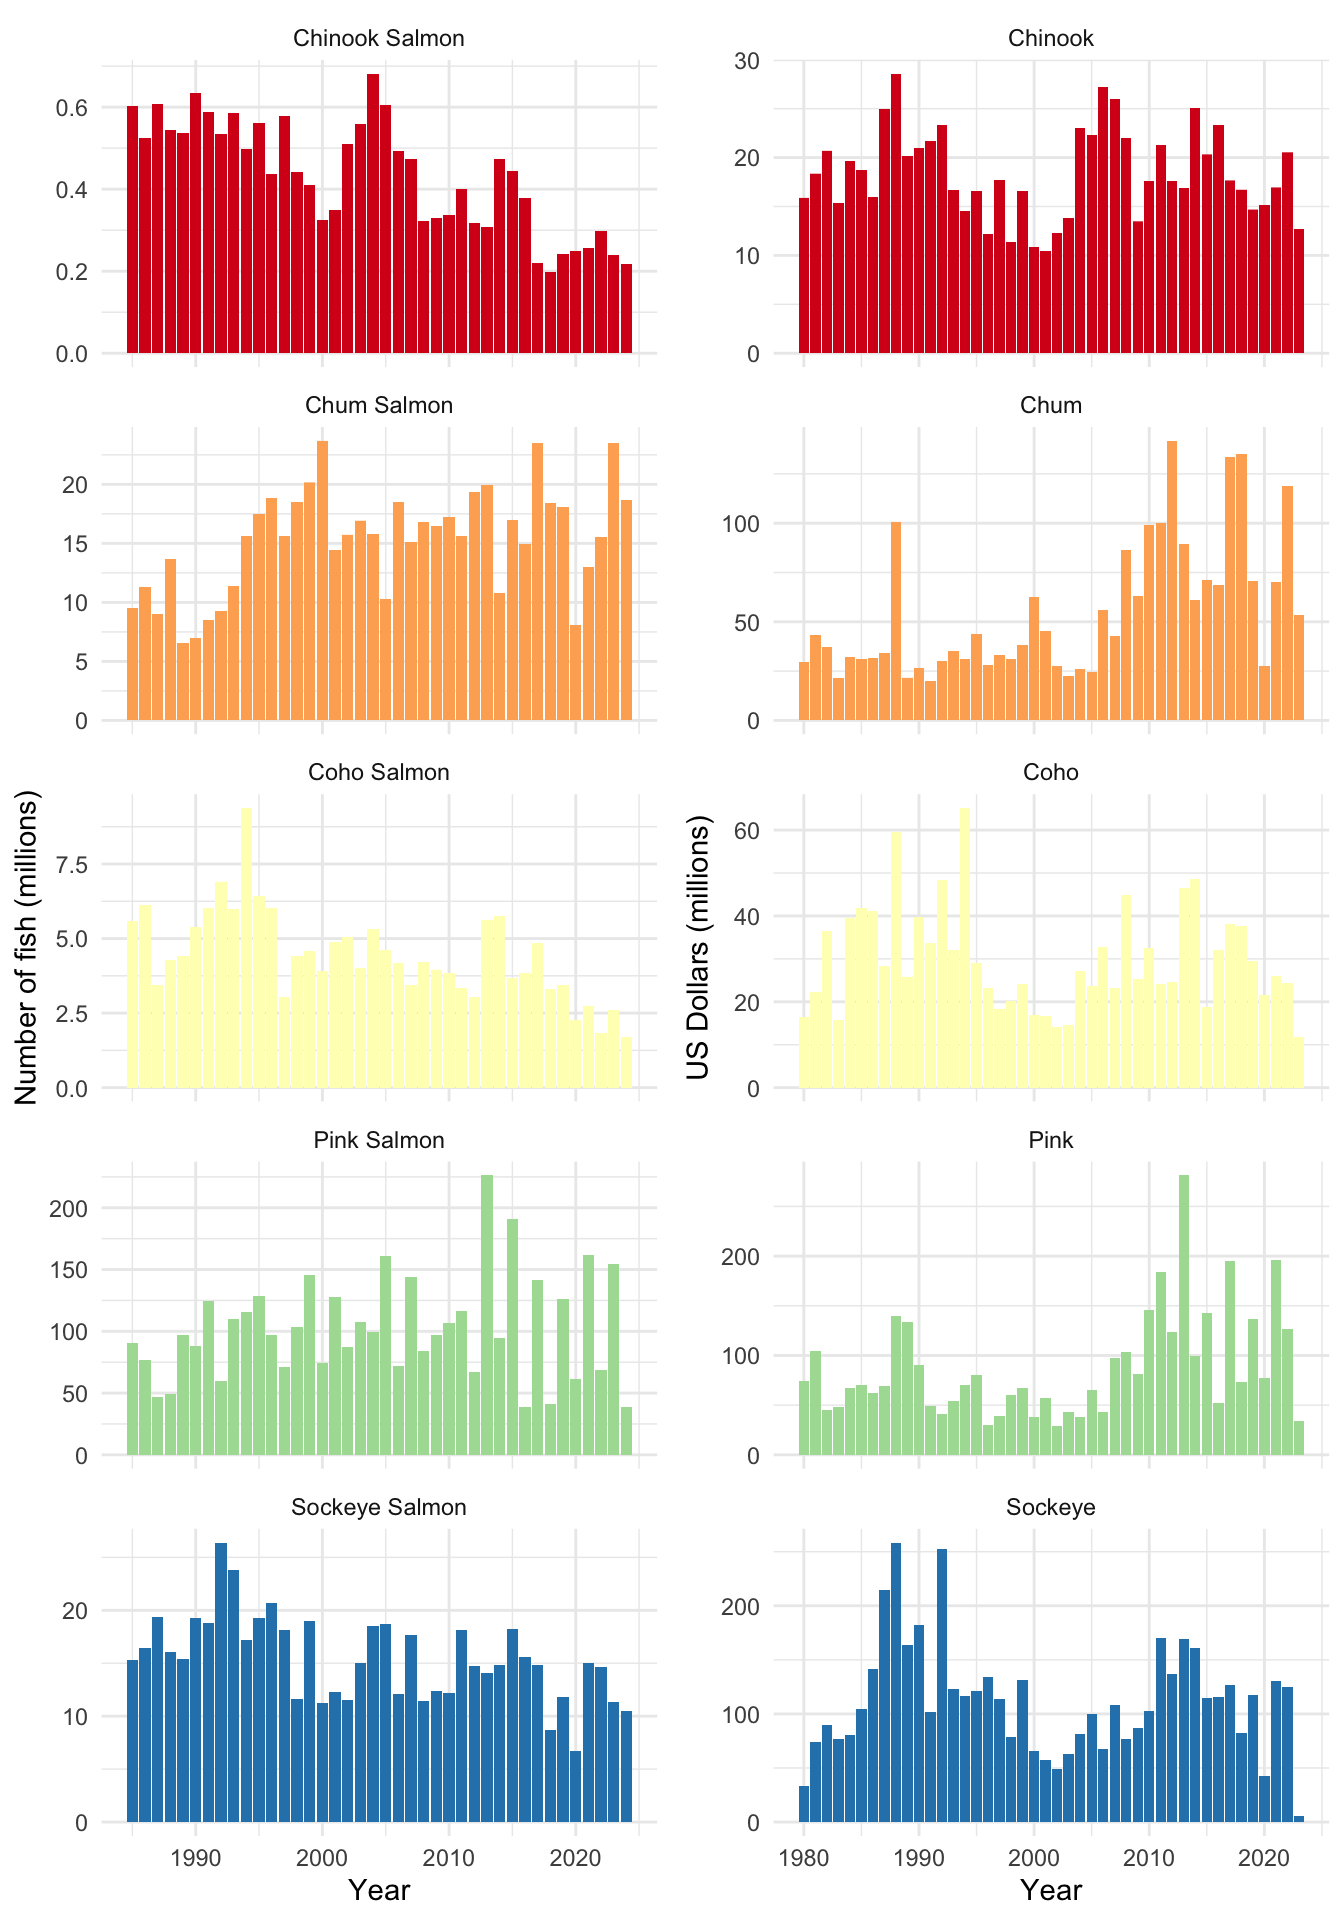
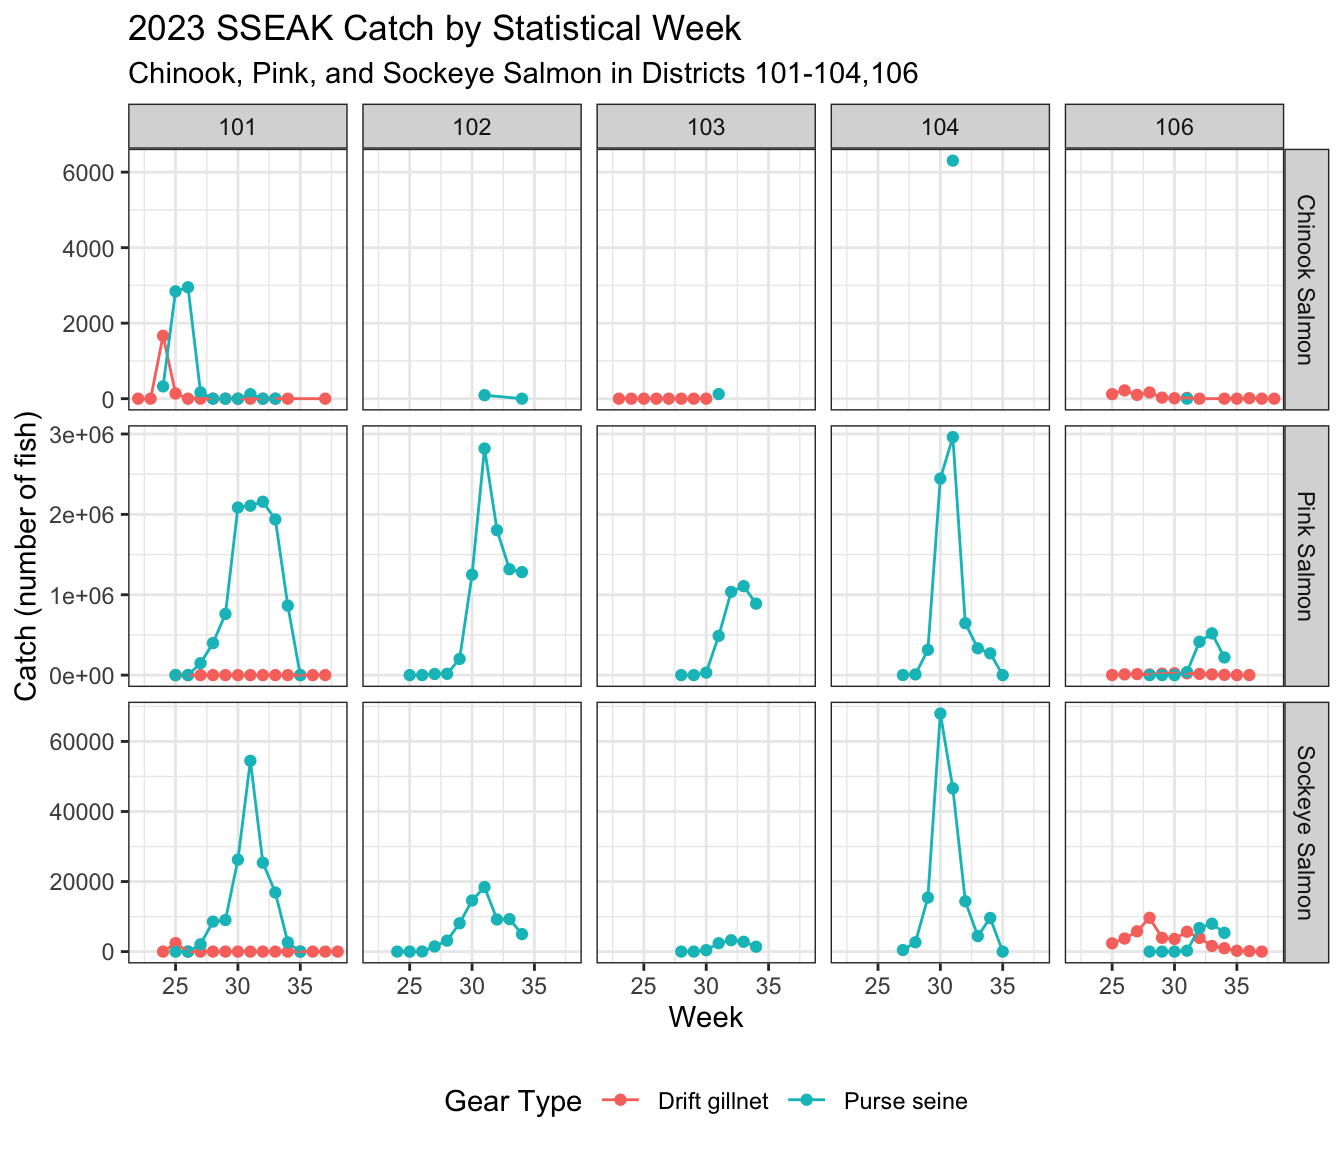
Figure 4 shows the catch of Chinook, pink and sockeye salmon from Southeast Alaska districts 101, 102, 103, 104, and 106 in 2023, for seines and gillnets.
Note that the pattern of harvest is similar to that in other years, with sockeye harvest peaking in the D104 fishery slightly before the peak in pink harvest. In 2023, pink harvest was highest in D104 and D102, with the vast majority of sockeye harvest from D104.
Chinook was non-retention in the purse seine fisheries through almost all of 2023, however in one day of opening ~ 6,000 Chinook were kept in D104.
Sockeye
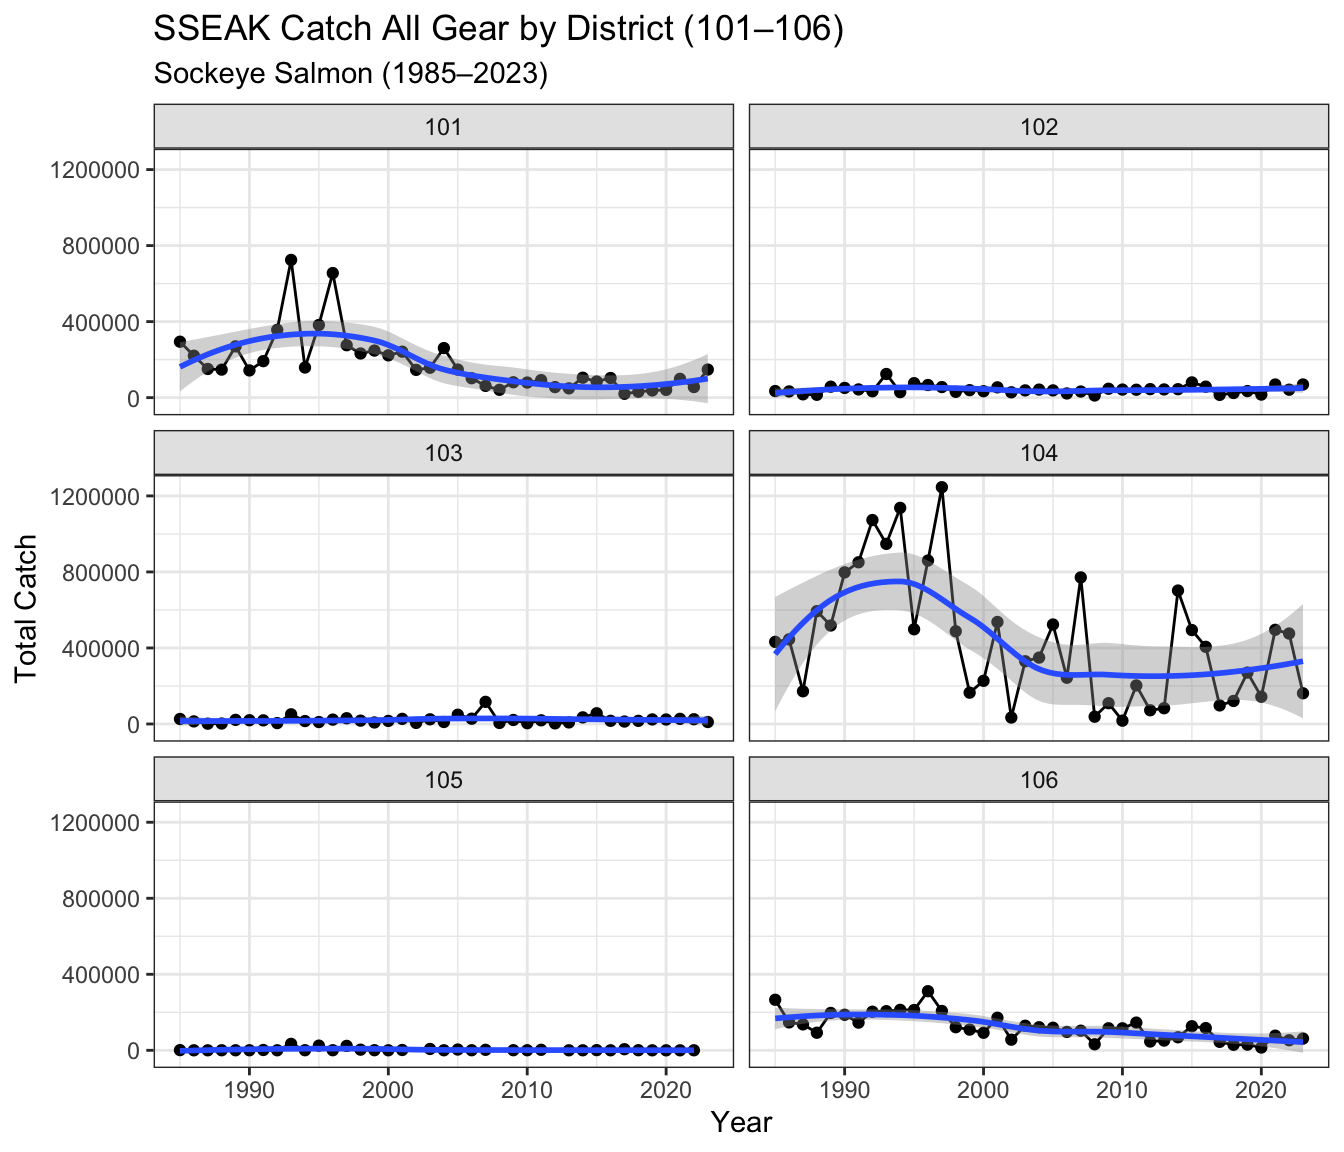
Total sockeye catches (all gears) in Districts 101 and 106 have declined since the 90s, total catch in Districts 102, 103, and 105 have remained low and District 104 total catch peaked in the 90s and declined to an average of ~ 225,000 since, with catches ranging from near 0 to almost 800,000 (Figure 5).
The following set of figures describe the commercial marine catch of Skeena and Nass sockeye in South Southeast Alaska (SSEAK) and BC, with specific information on the proportion of catch between regions and trends over time. We also provide a more detailed summary of information on specific fisheries in SSEAK (e.g. with focus on District 104 and the Noyes and Dall Island fishing areas). Data source is provided in each figure.
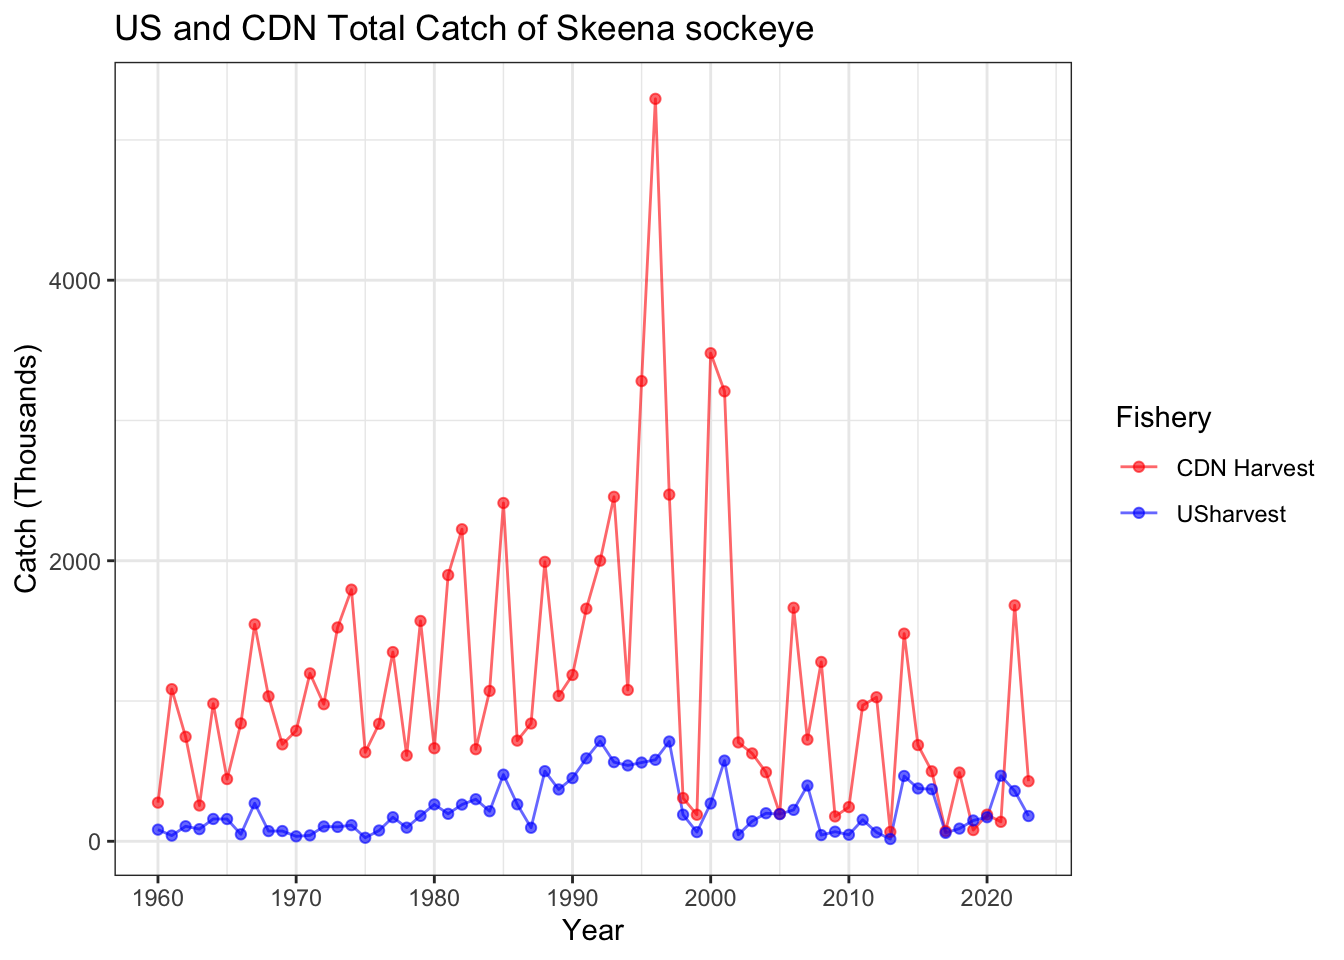
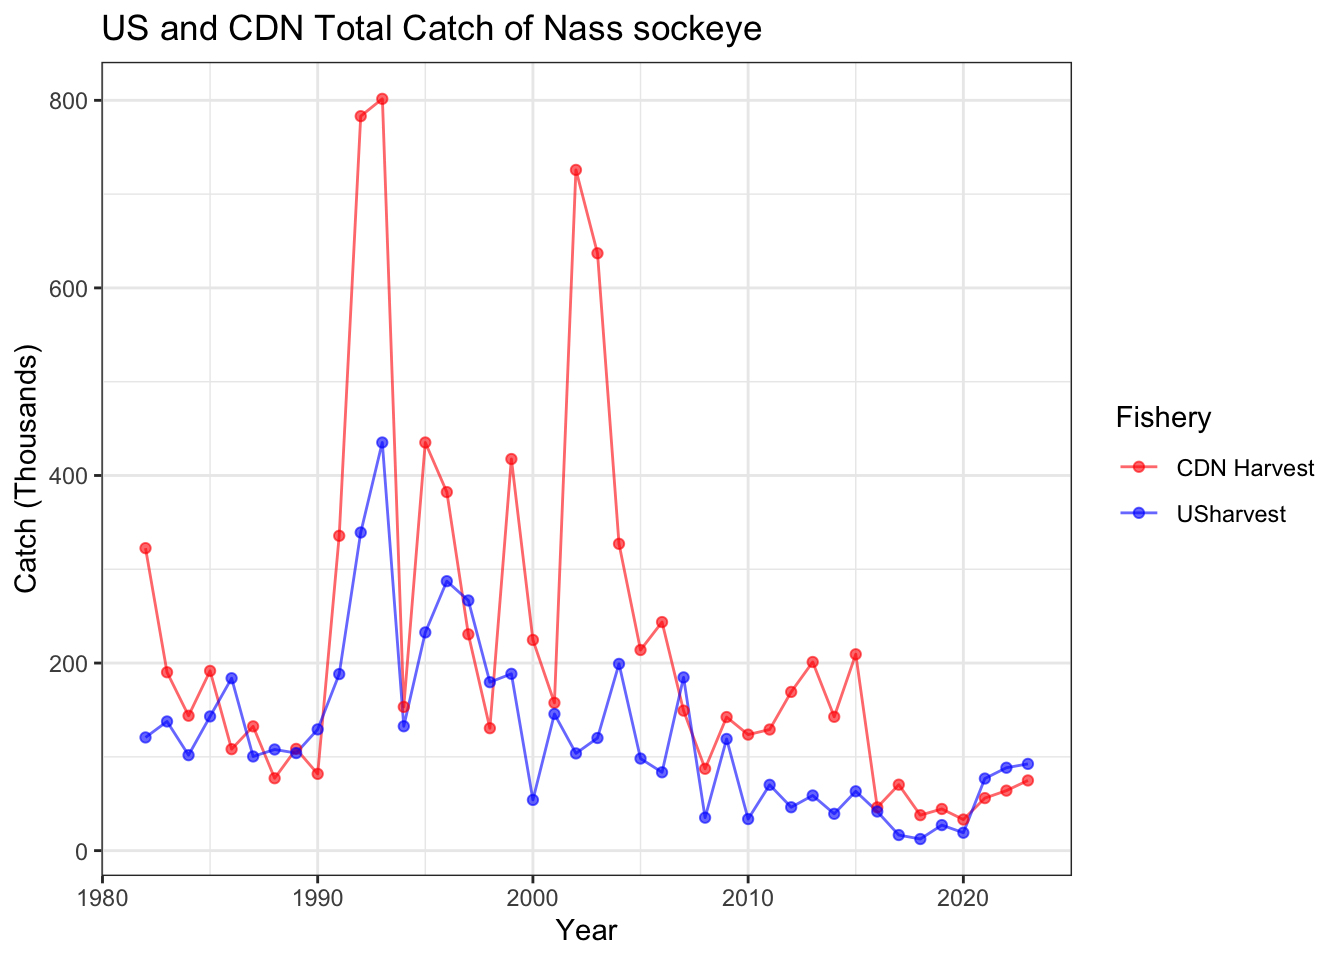
US and Canadian commercial catch have declined since the 1990s for both Skeena (Figure 6) and Nass (Figure 7) sockeye.
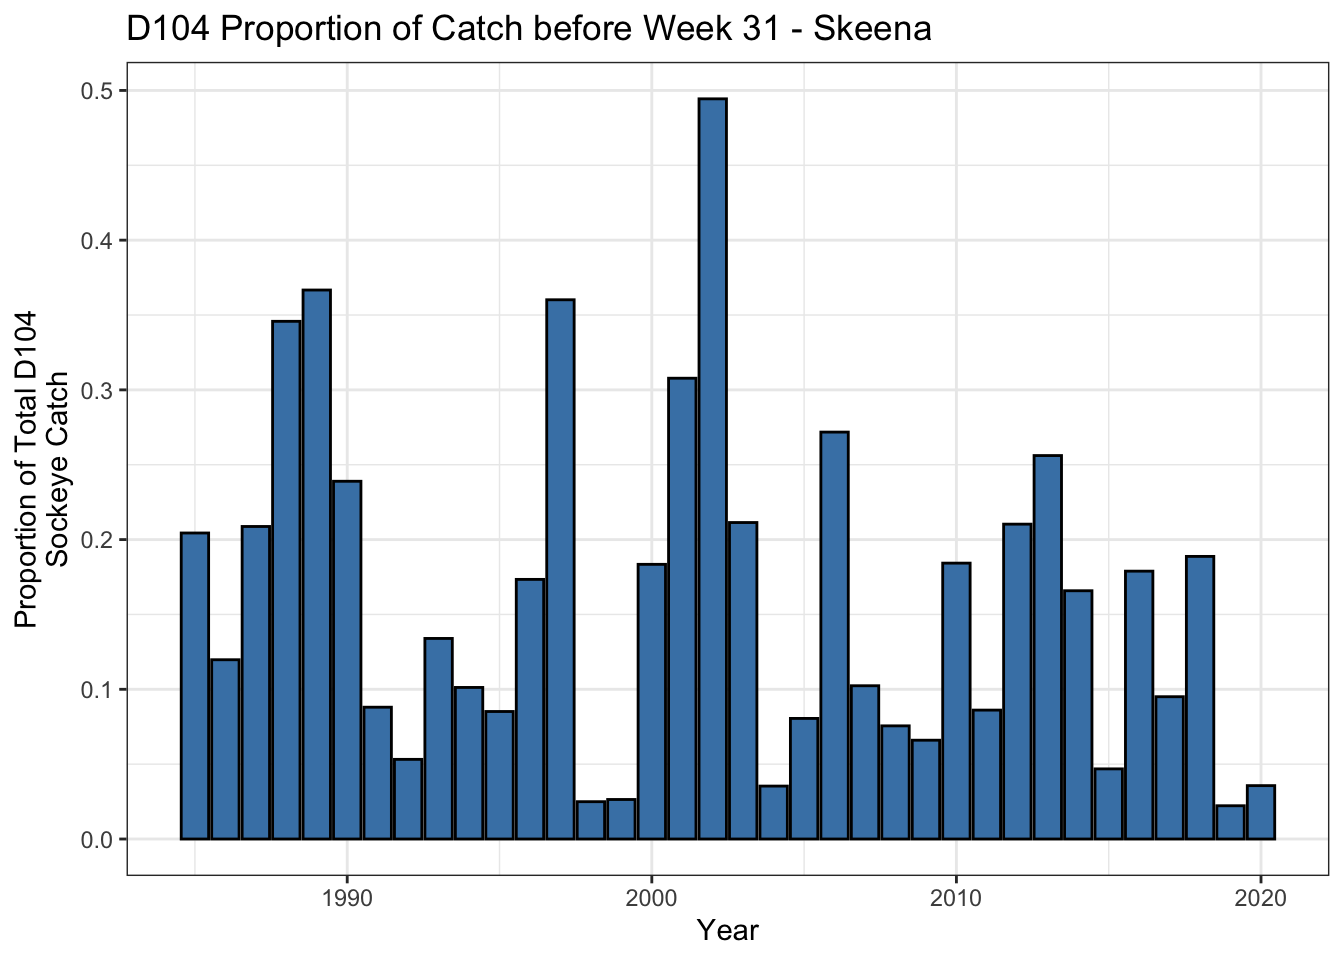
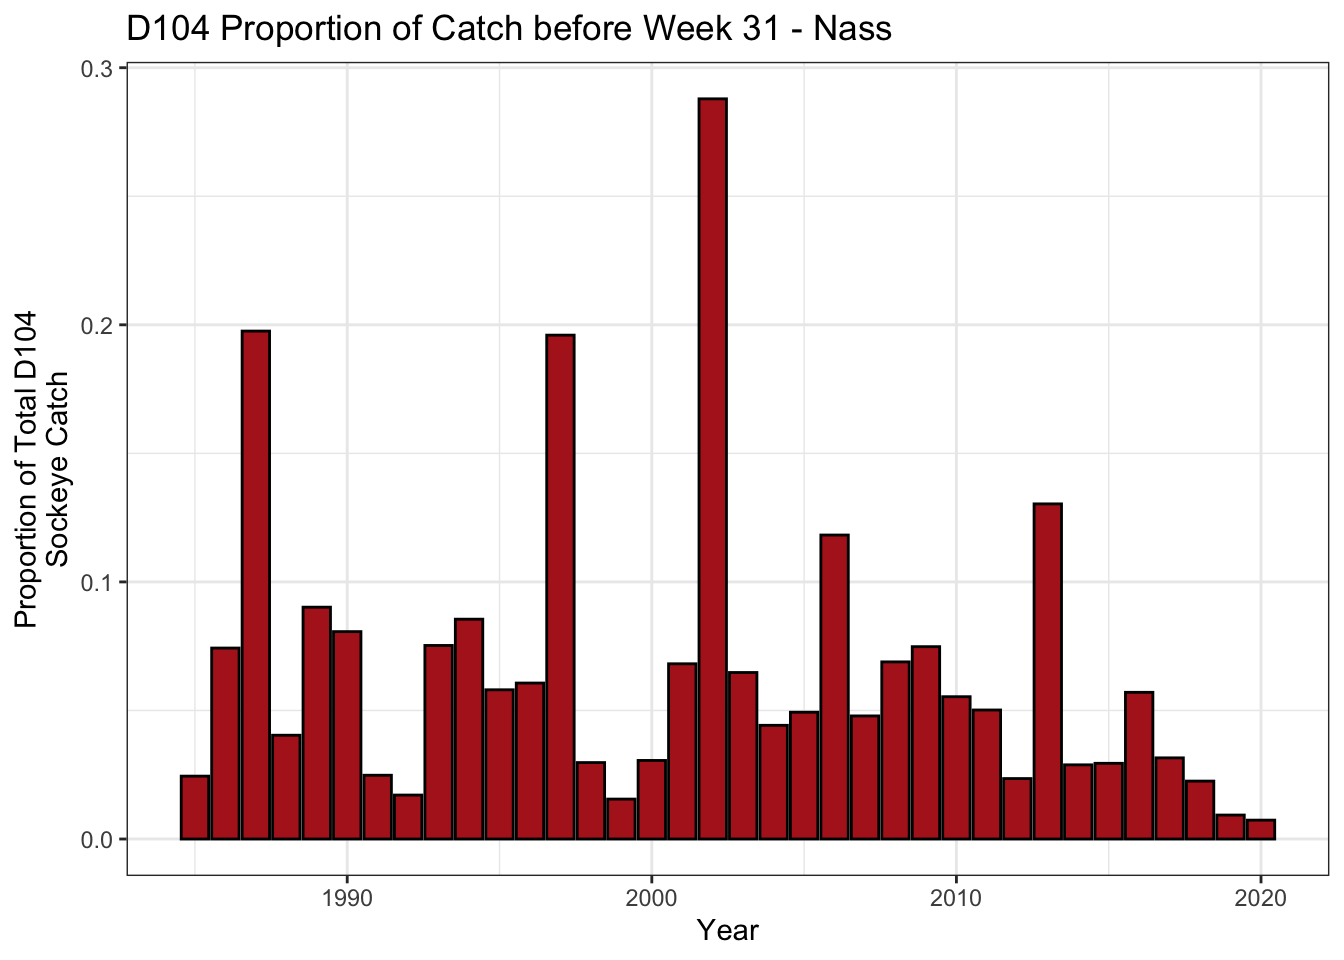
Chapter 2 of the Pacific Salmon Treaty contains a clause that limits harvest of sockeye prior to Statistical Week 31 (end of July) in the District 104 seine fishery. The proportion of catch prior to Week 31 out of the total District 104 sockeye catch is shown for Skeena (Figure 8) and Nass (Figure 9) sockeye. Although variable, the proportion of sockeye harvested before Week 31 has declined for Nass sockeye, and was very low in 2019 and 2020 for Skeena sockeye. This could be an indication of later timed runs to the Skeena and Nass.
SEAK sub-area exploitation rate distributions over all years on Skeena and Nass sockeye are shown in Figure 10.
Notably, the Noyes and Dall (District 104) fisheries have the most significant impact on Skeena sockeye, followed by the Tree Point (District 101) and Lower Clarence (southern District 102) fisheries.
For Nass sockeye, the Tree Point fishery has the most significant impact, followed by the Noyes, Dall, and Lower Clarence fisheries. This highlights the different migration routes of Skeena and Nass fisheries, where Nass sockeye are much more susceptible to harvest in District 101.
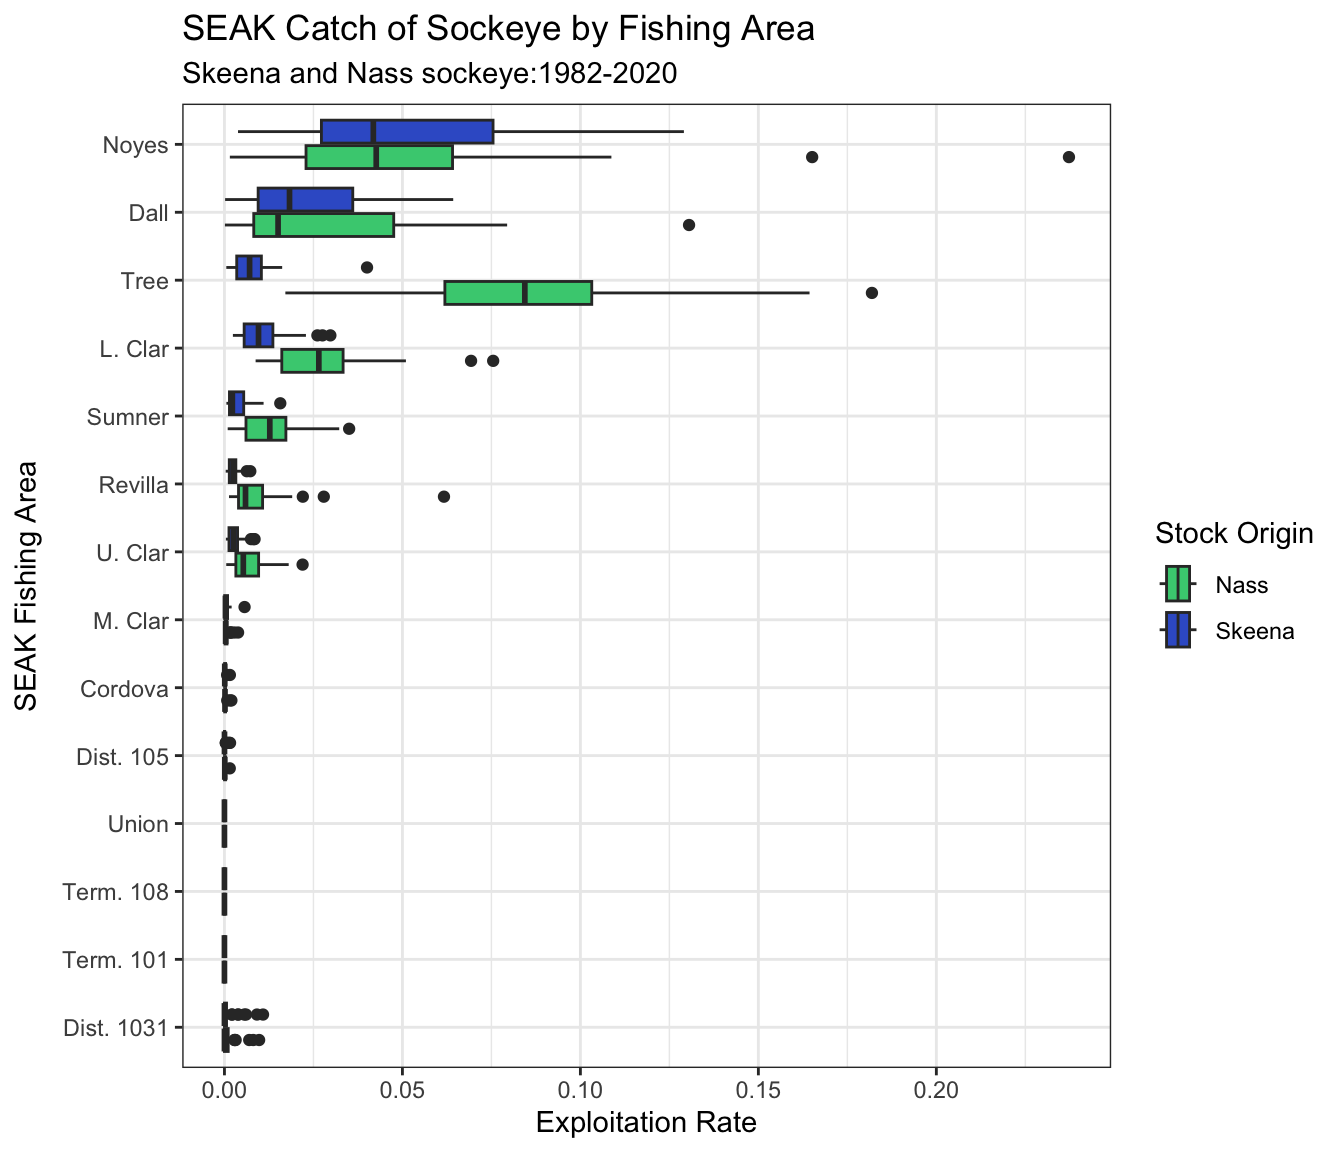
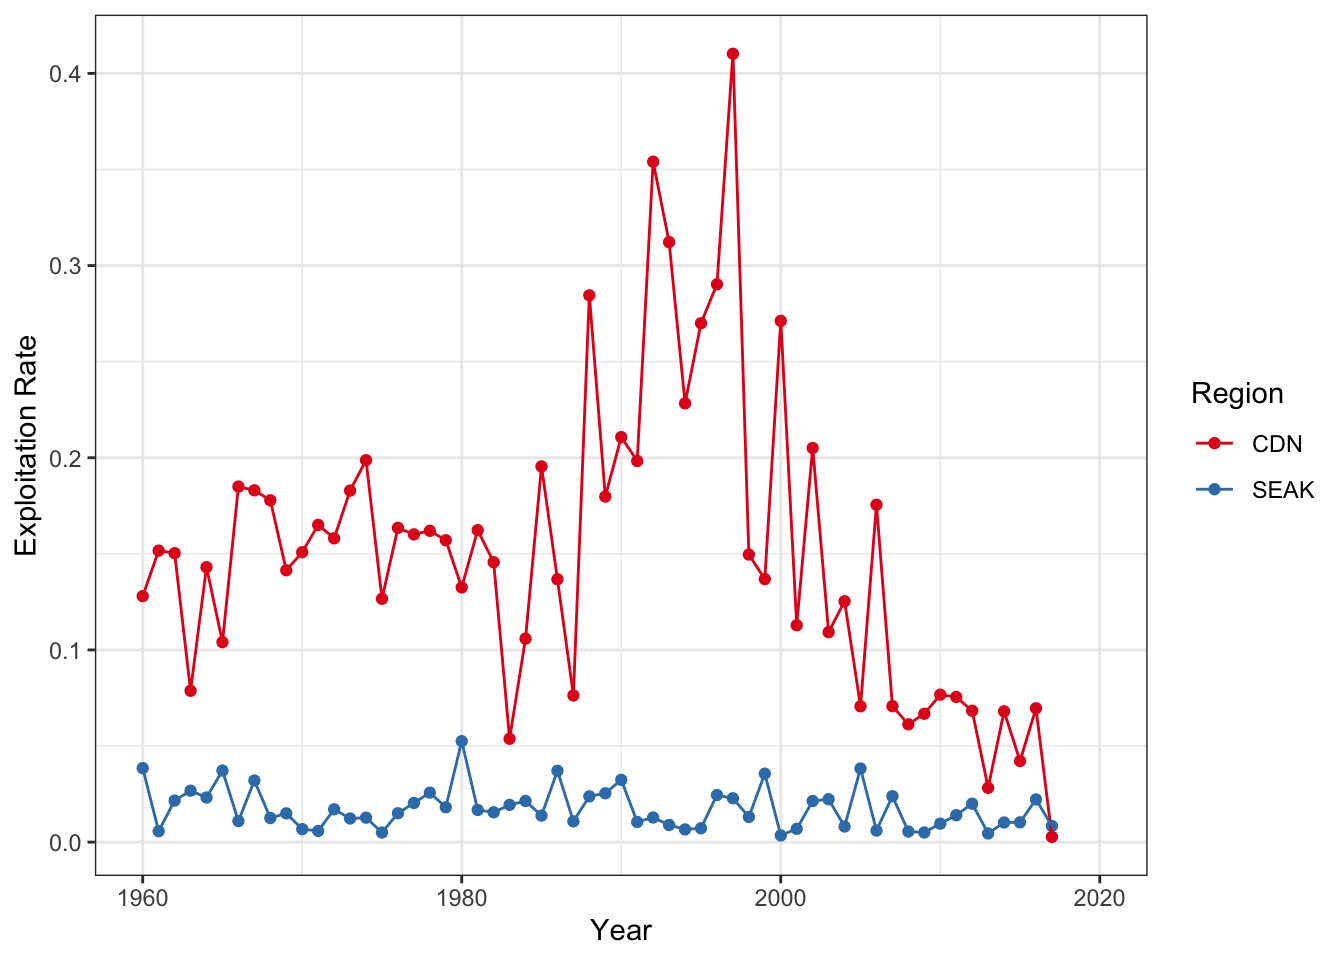
Figure 11 shows the Canadian and Alaskan exploitation rates of Area 5 sockeye salmon. Estimated Canadian ERs averaged around 15% in the 60s-80s, peaked in the 90s at around 30% and have since declined dramatically to between 0 and 8% in the last 10 years. Alaskan ERs have remained relatively constant between 0 and 5%.
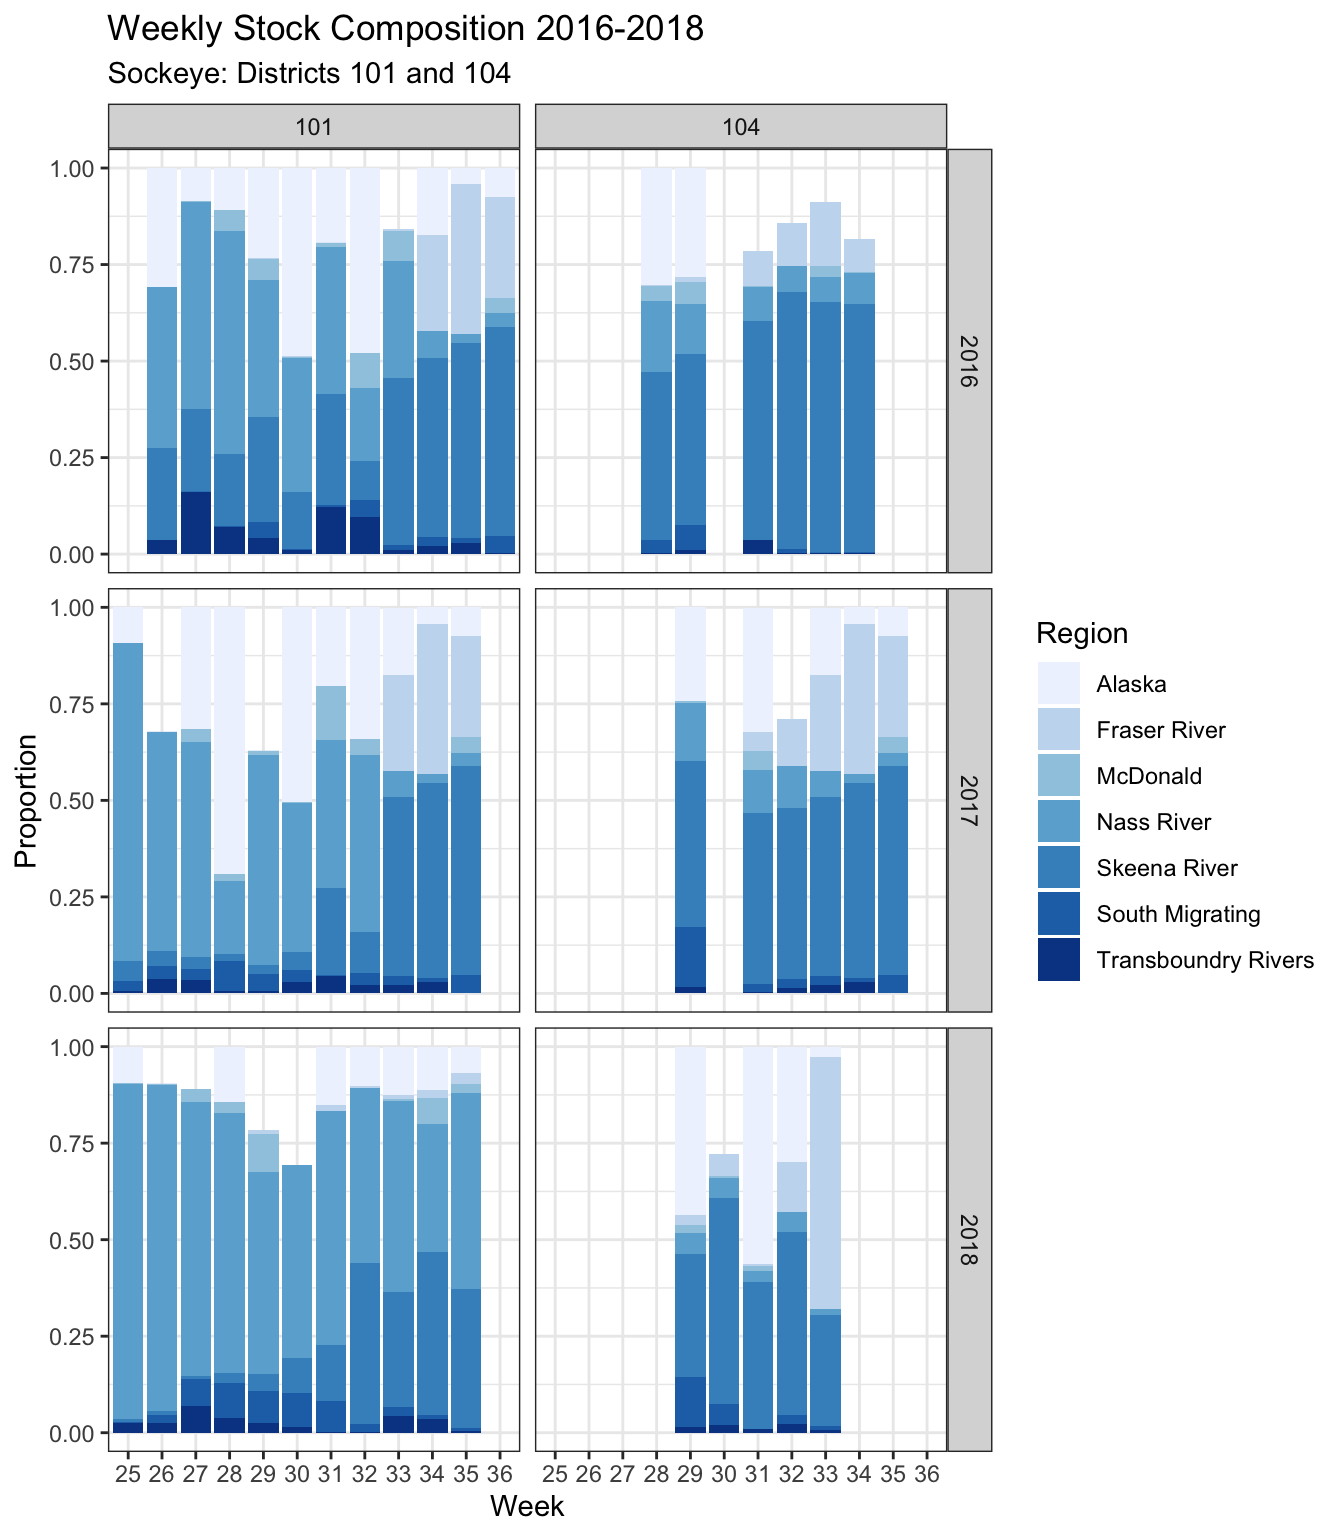
The PSC Northern Fund final reports provide stock composition estimates by regional reporting groups based on genetic analyses of fisheries samples. We extracted stock composition data for District 101 commercial gillnet fishery and the District 104 commercial purse seine fisheries from the three most recent years available (Guthrie et al. 2018, 2019a, 2019b). Weekly stock compositions are shown in Figure 12. While Skeena and Nass (and Alaska) sockeye dominated catches in these 3 years in both fisheries, there was a small portion of catch attributed to the South Migrating reporting group separate from Fraser River sockeye. It is important to note that the reporting groups were condensed in fishery year 2016, so that those reports previous to 2016 showed a greater resolution of south migrating stocks and showed Central Coast BC and Queen Charlotte Island reporting groups (Guthrie et al. 2010, 2011, 2012, 2013, 2014, 2015a, 2015b, 2016, 2017). While these reporting groups were only present in fisheries in small proportions, sample size and power to detect low abundance populations may have been an issue. In summary, BC sockeye from areas other than the Fraser, Skeena and Nass Rivers are likely present in these fisheries in most years.
Information on Alaskan interceptions of Fraser sockeye by Canadian, Washington and Alaskan fisheries from 2000-2022 were provided by the Pacific Salmon Commission (PSC 2021a) and DFO (Les Jantz and Jamie Scroggie, personal communication, 2021). Additional information at the Conservation Unit/Stock level was provided in Latham and Samarasin (2018), which is a draft report summarizing the results of genetic analysis using Single Nucleotide Polymorphisms (SNPs) from sockeye samples collected during the 2018 fishing season from Alaskan District 104 seine fisheries.
Alaskan catch of Fraser sockeye averaged ~ 60,000 from 2000 to 2020 (Figure 13, top panel). Canadian catch averaged ~ 2.2 million and Washington catch averaged ~ 320,000 over the same period. However, due to the cyclic nature of Fraser sockeye catch, average catch may not be an appropriate indicator of each fishery’s relative impact in a given year. Alaskan exploitation is typically estimated to be very low (< 5%), with only 2 years 10% or higher (Figure 13, middle panel). The percent of total Fraser sockeye catch attributed to Alaskan fisheries is typically low, however there are a number of years where the proportion of Alaskan catch has been near to or much greater than the Canadian proportion (Figure 13, bottom panel). This can likely be attributed to abundance-based management in PSC Fraser Panel waters, where in low abundance years Washington and BC fisheries targeting Fraser sockeye would be severely curtailed, whereas Alaskan fisheries are independent of Fraser sockeye abundance. In 2018, Alaskan catch of Fraser sockeye was estimated to be ~ 53,000 (PSC 2021). Of this, Shuswap Lake sockeye dominated the catch (57%), followed by Quesnel (22%) and Chilko (13%) sockeye (Latham and Samarasin 2018).
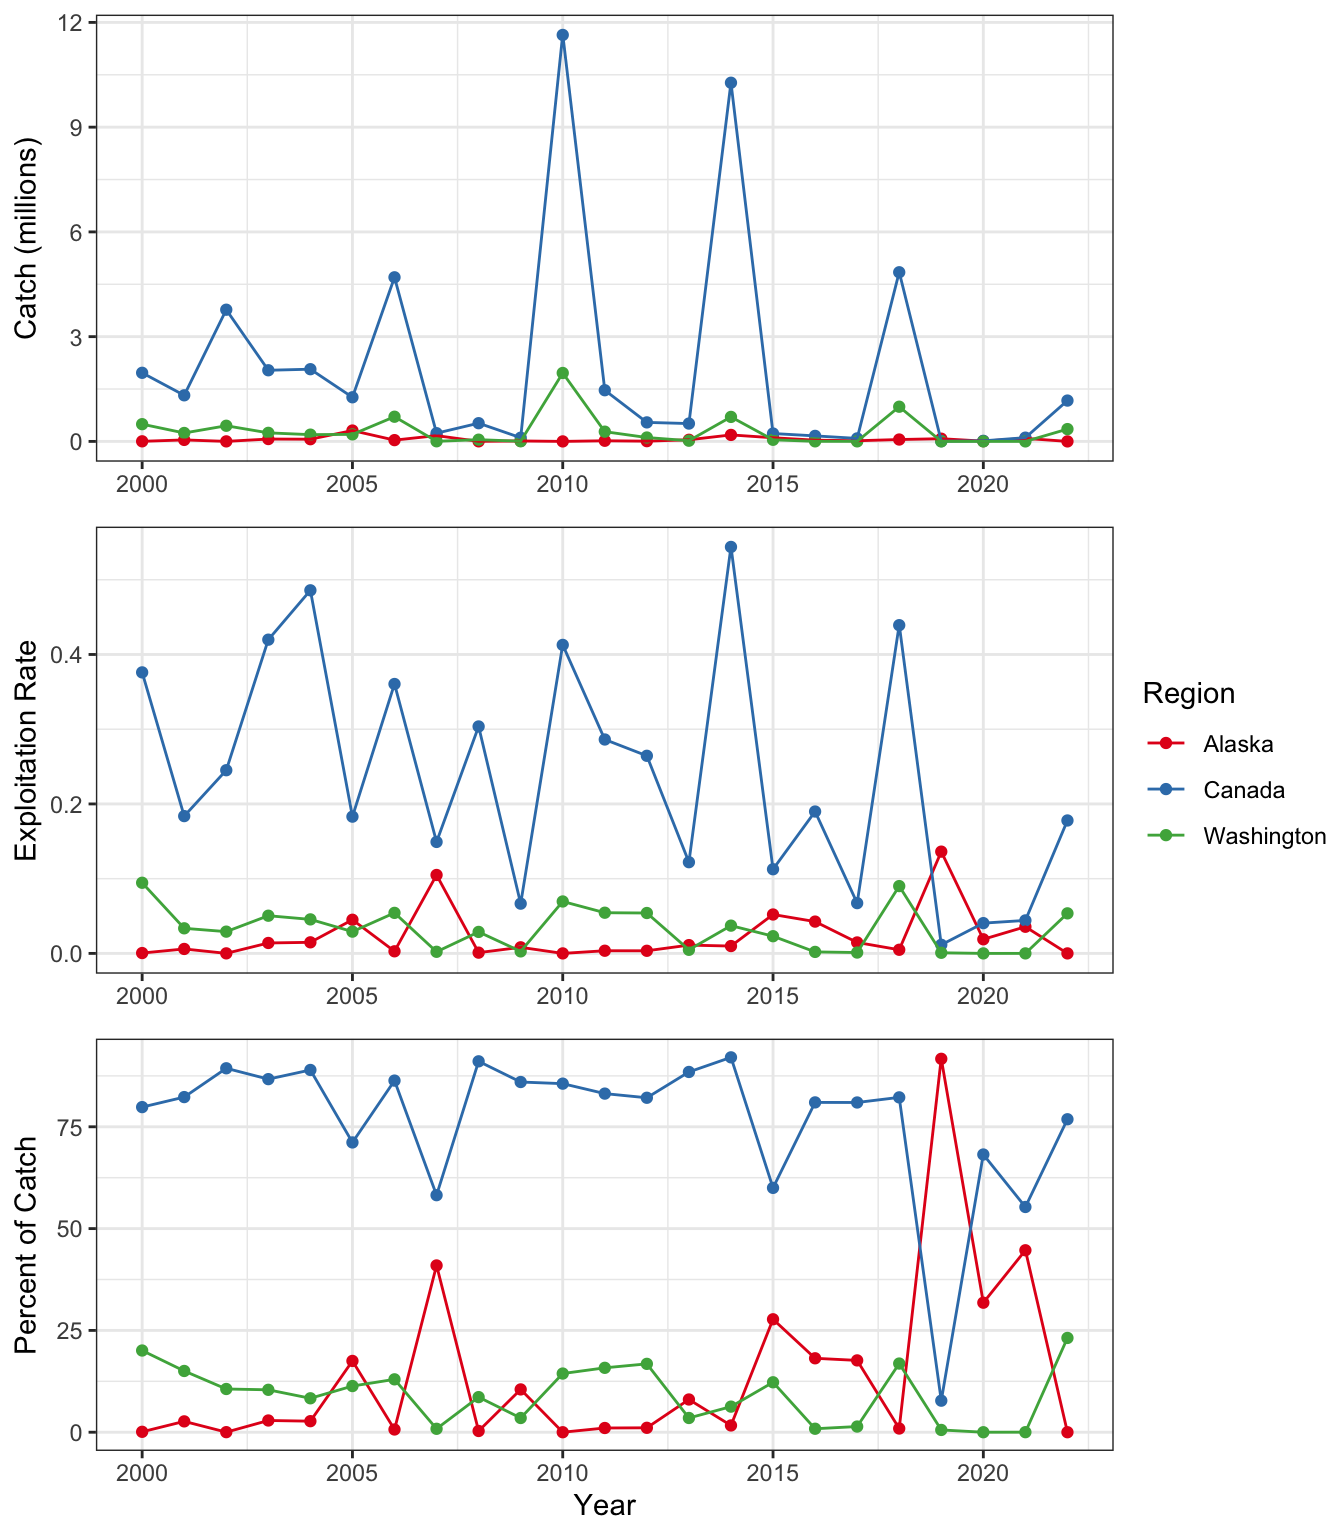
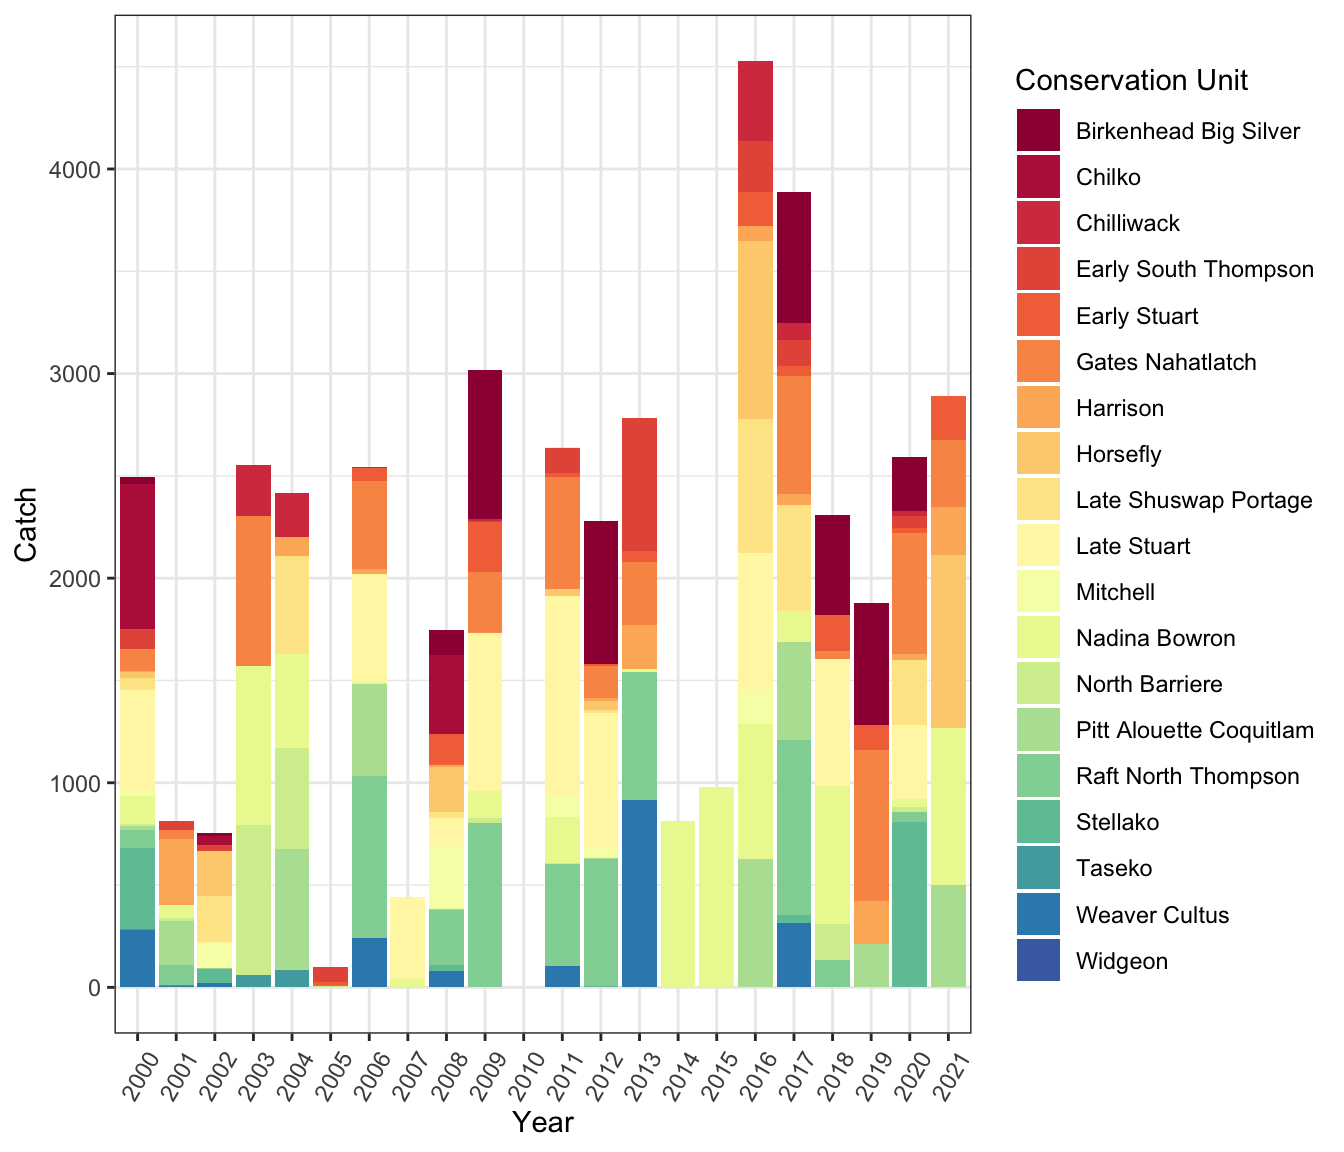
Figure 14 shows the stock composition of Fraser River sockeye catch by Conservation Unit between 2000 and 2021.
Skeena
- Alaskan fisheries catch all species of salmon in the Skeena
- Catch of Skeena sockeye is estimated through the Northern Boundary Run Reconstruction Model and can be very high in some years, especially on late timed populations
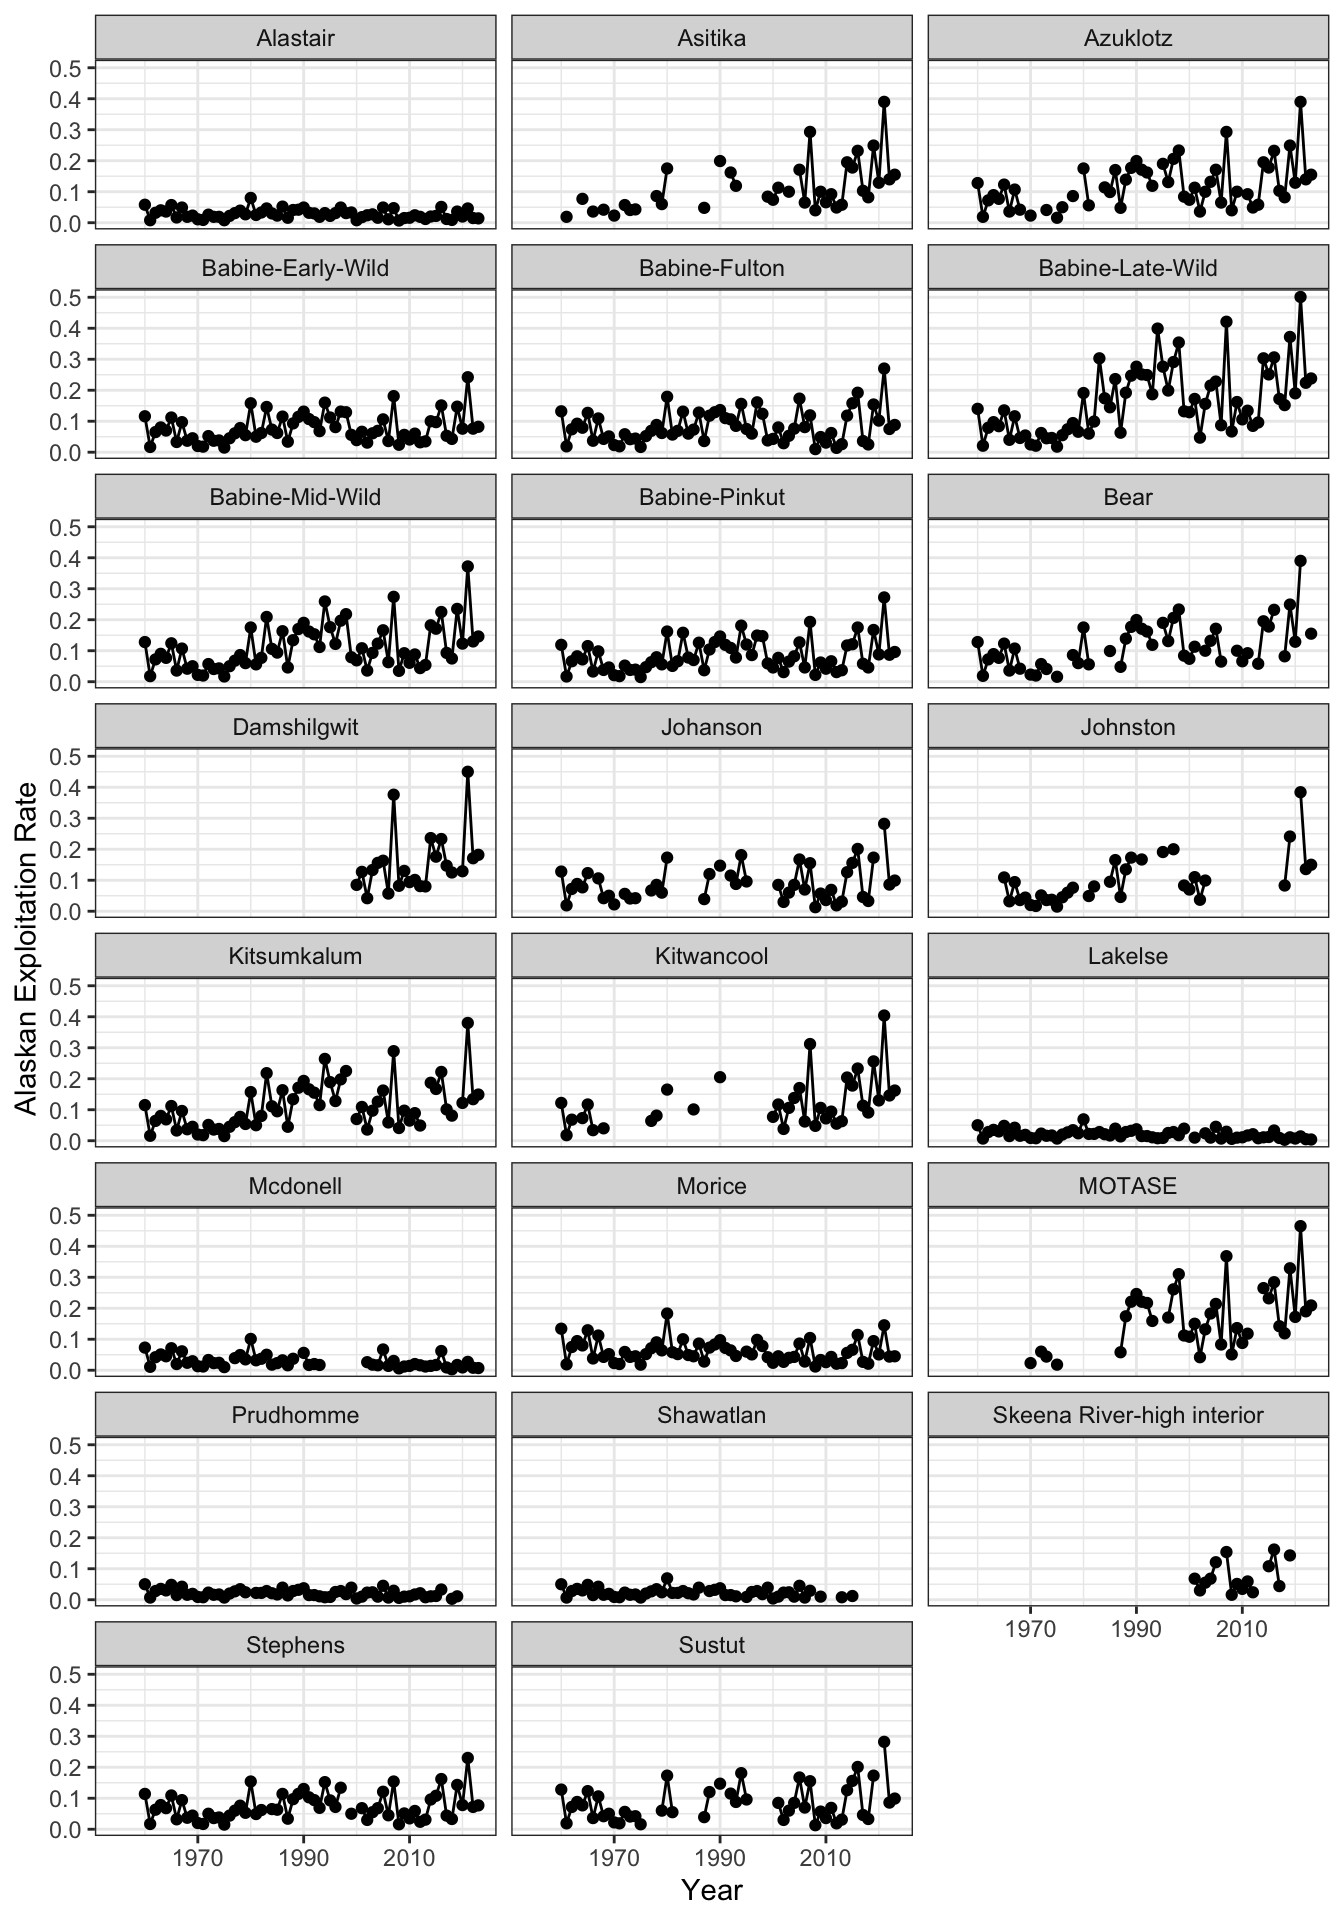
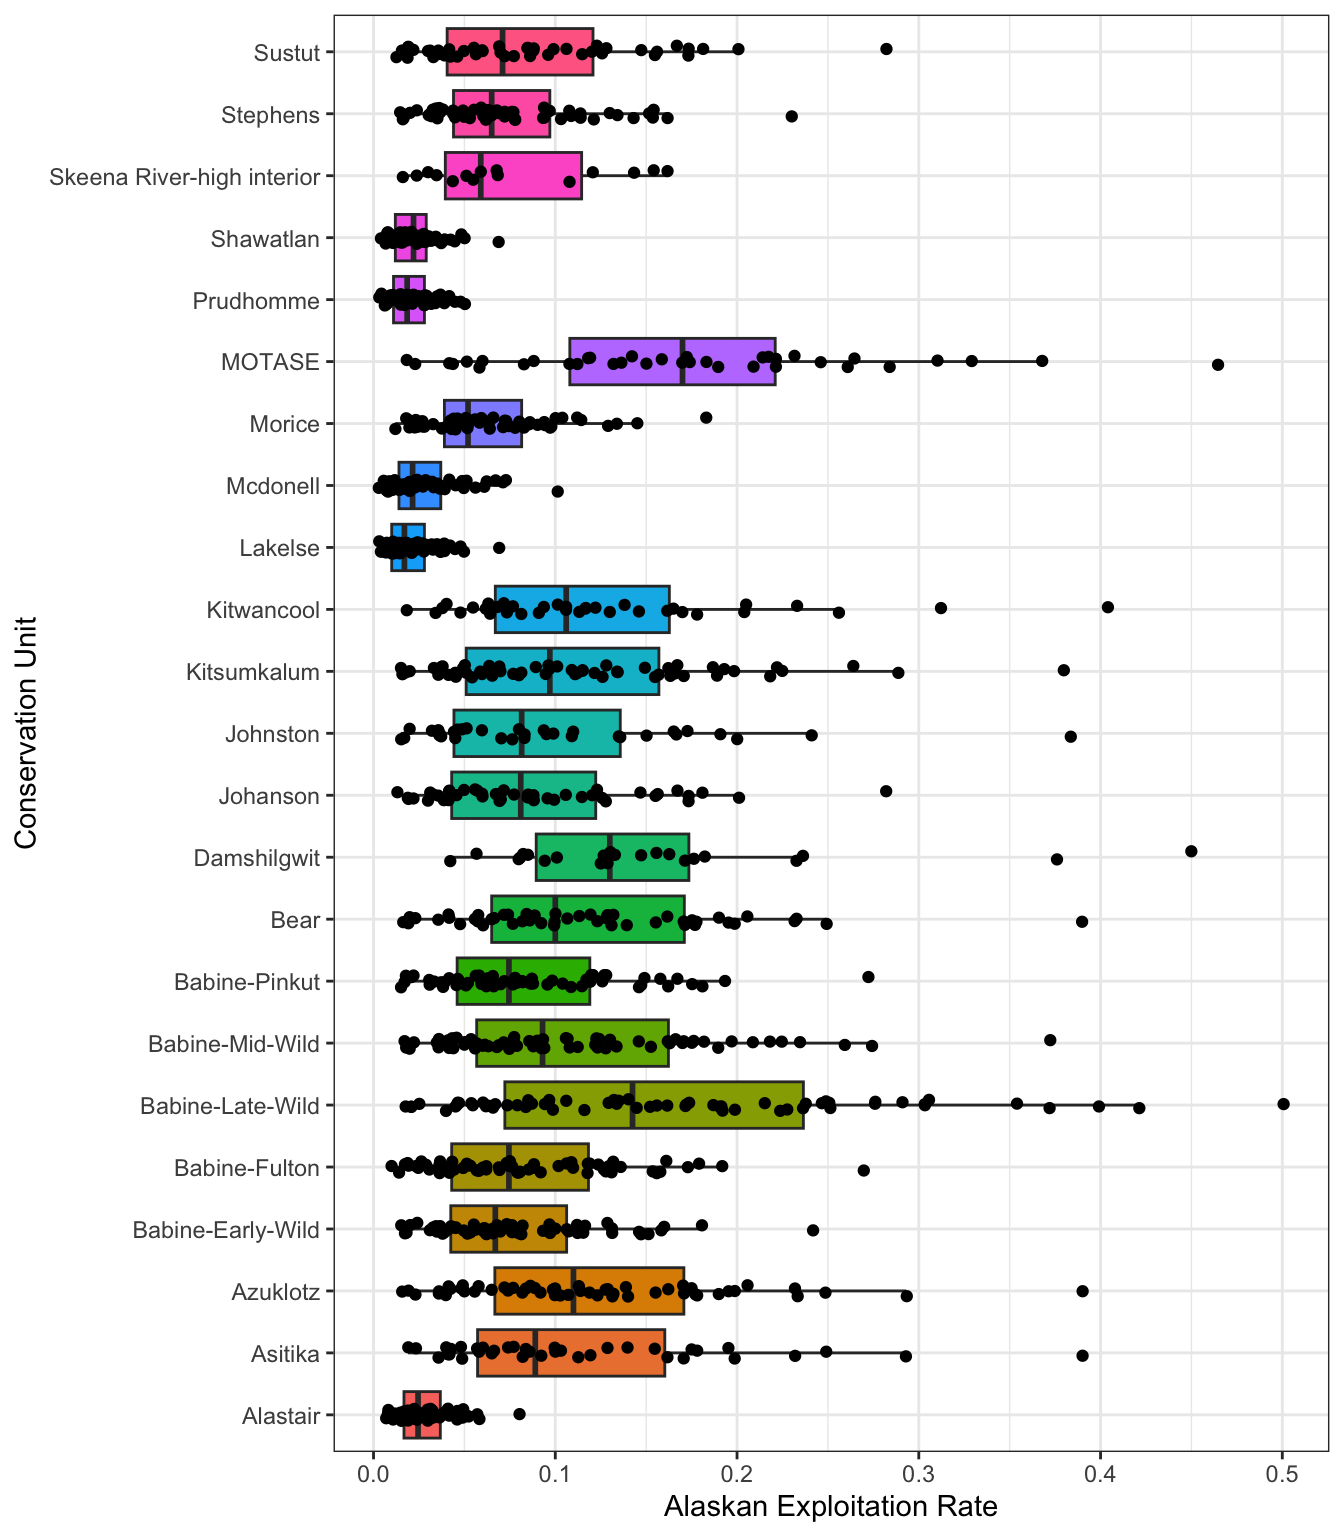
Information on Alaskan exploitation of Skeena sockeye comes primarily from the Northern Boundary Sockeye Run Reconstruction model, which uses estimated run-timing and migration route to provide estimates of interception rates in Alaska fisheries. We show time-series of Alaskan exploitation rates for each Skeena sockeye Conservation Unit with information (Figure 15) and the distribution of exploitation rates (Figure 16).
Nass
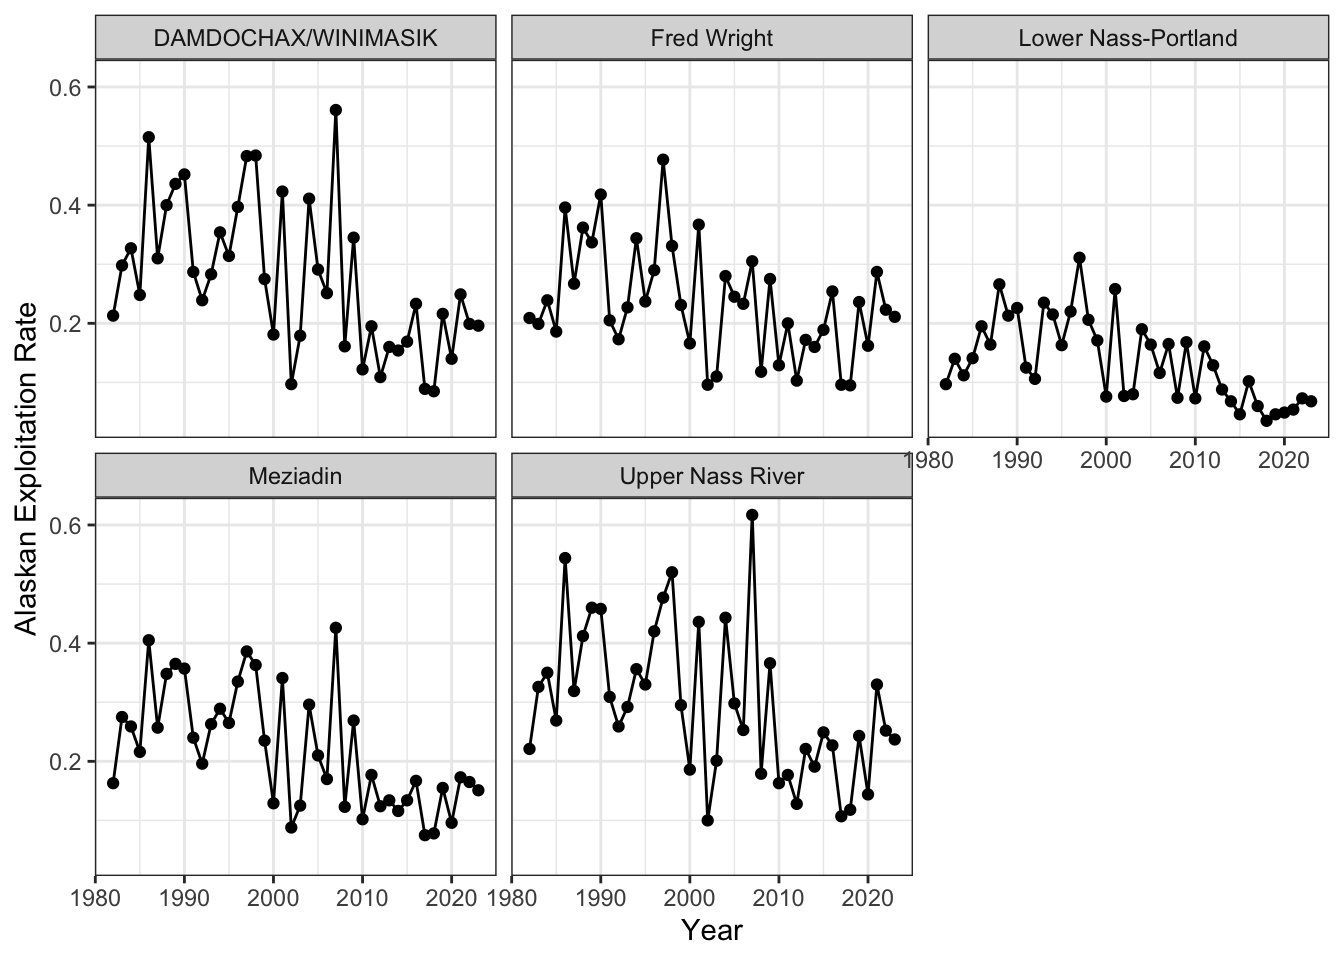
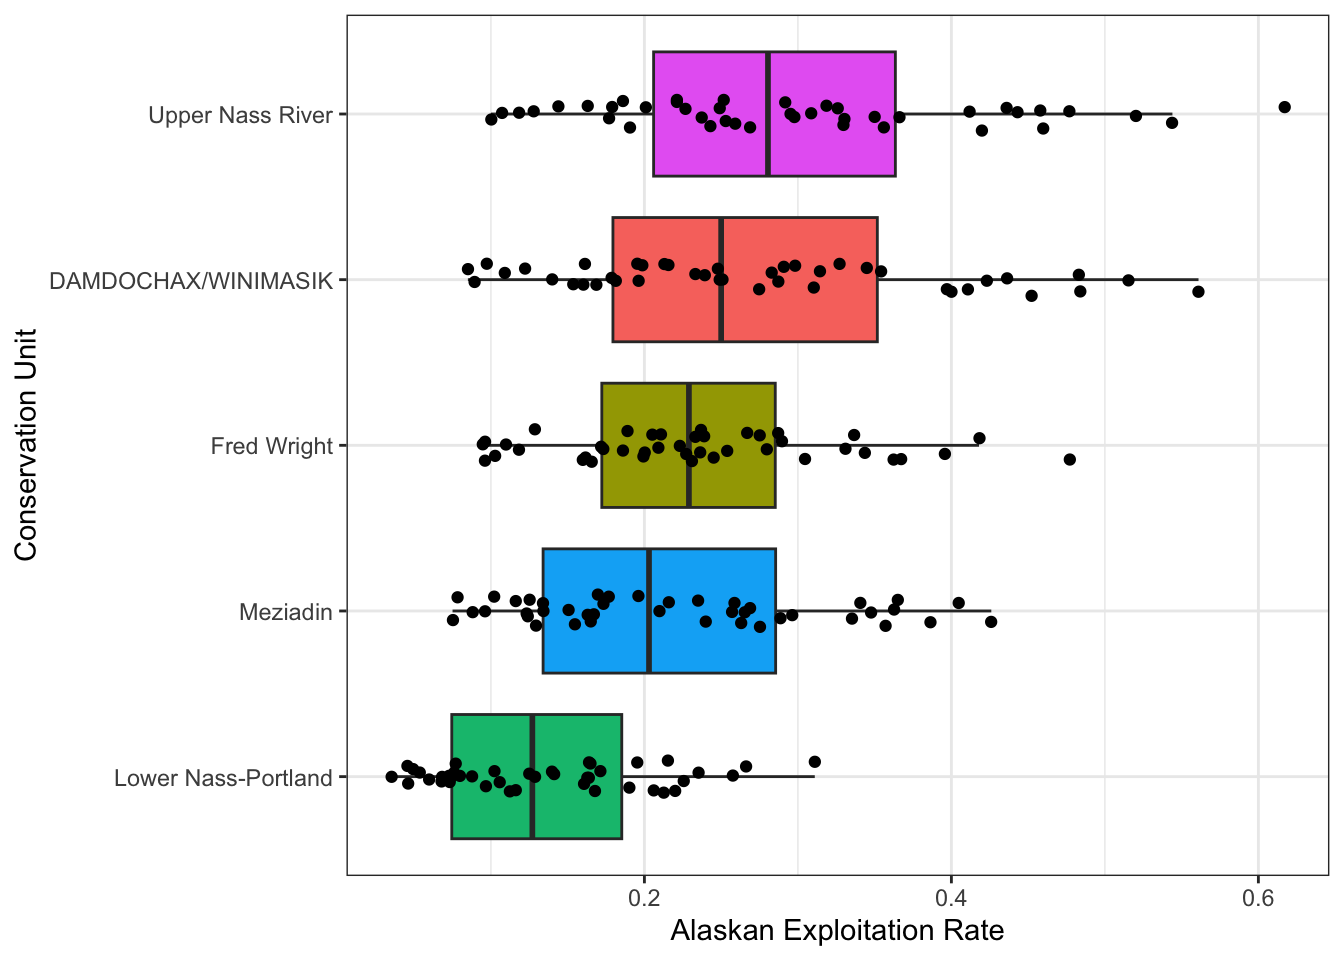
Information on Alaskan exploitation of Nass sockeye comes primarily from the Northern Boundary Sockeye Run Reconstruction model, which uses estimated run-timing and migration route to provide estimates of interception rates in Alaska fisheries. We show timeseries of Alaskan exploitation rates for each Nass sockeye Conservation Unit with information (Figure 17) and the distribution of exploitation rates by CU (Figure 18).
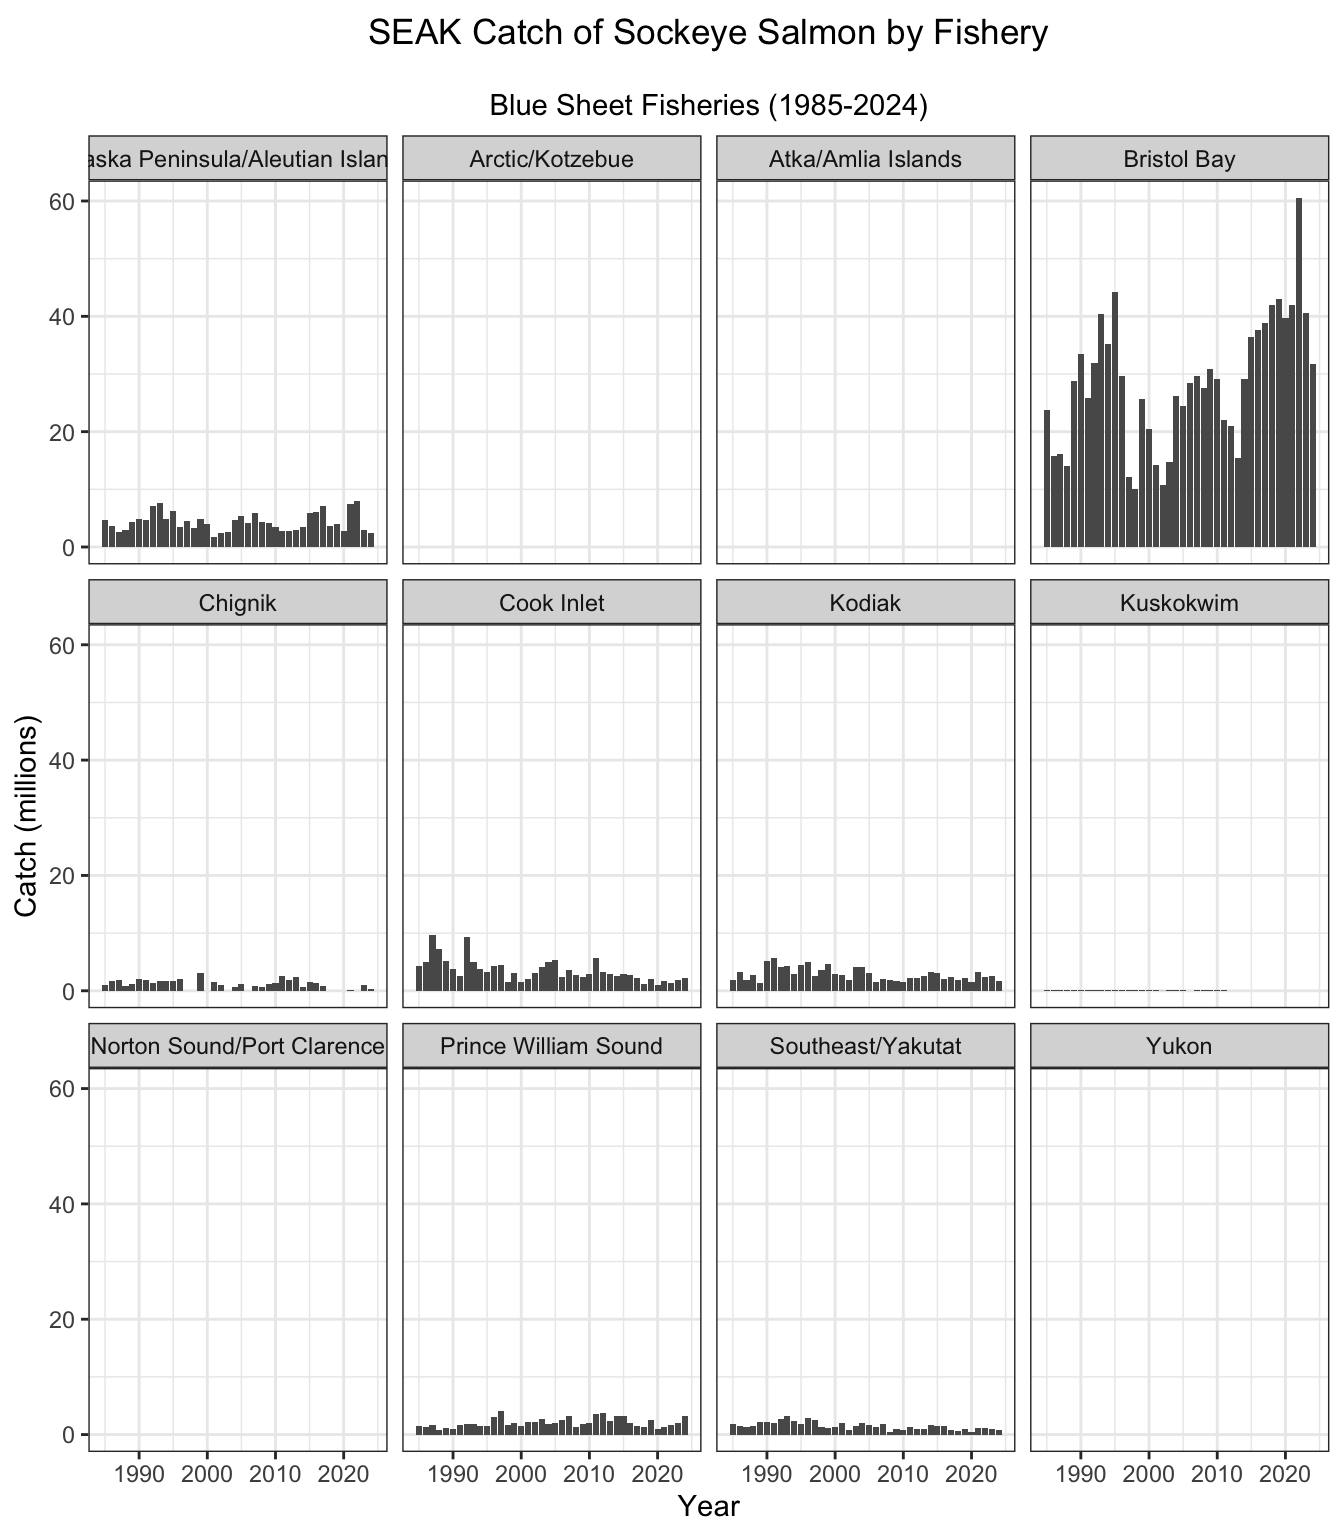
ADFG “Blue Sheet” harvest data for SEAK commercial fisheries was requested and provided from ADFG for 1979-2024. Figure 19 shows the harvest of sockeye salmon by SEAK fishery for 1979-2024. Sockeye salmon are primarily caught in the Bristol Bay, Alaska Peninsula/Aleutian Islands, Cook Inlet, and Kodiak fisheries, as well as Prince William Sound, Southeast/Yakutat, and Chignik fisheries.
Chinook
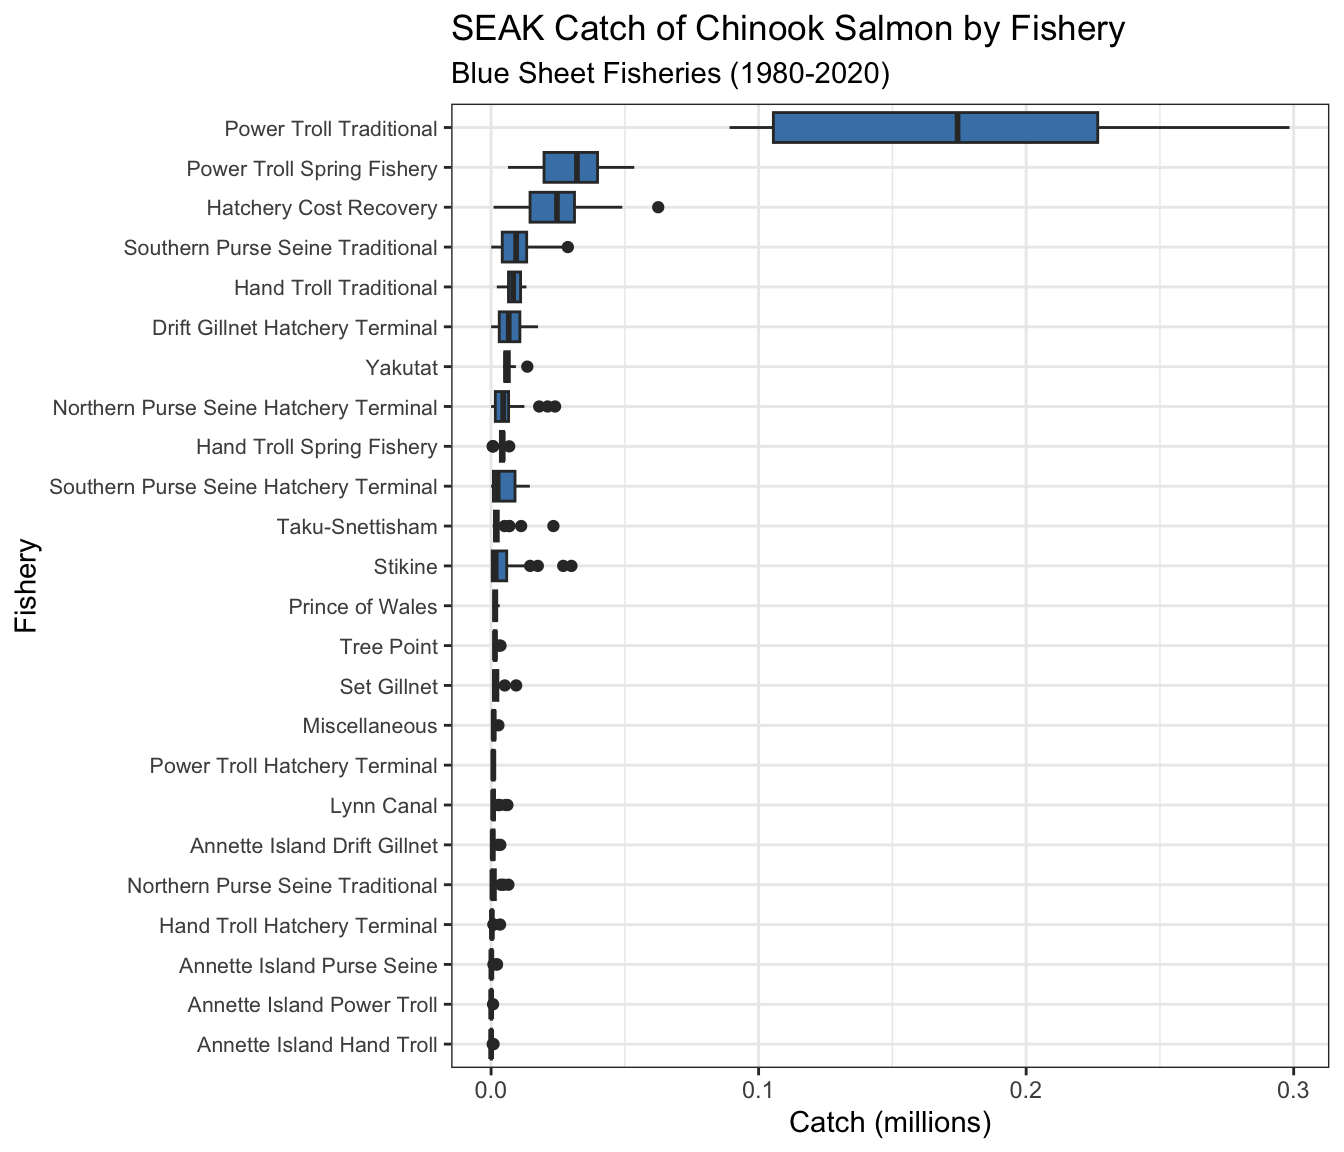
Chinook salmon catch in SEAK is historically dominated by power troll traditional (60%) and spring (11%) fisheries, with smaller contributions (< 25,000 median catch) from other fisheries (e.g., southern purse seine, hatchery cost recovery, etc.) (Figure 20). Median catch from 1980-2021 in the southern purse seine fisheries is just under 10,000, but in some years can be much higher (20-30,000). The total 2021 catch in Southern Purse Seine fisheries was 6,836 (ADFG 2021c), lower than the median catch at the ~ 35th percentile of all years.
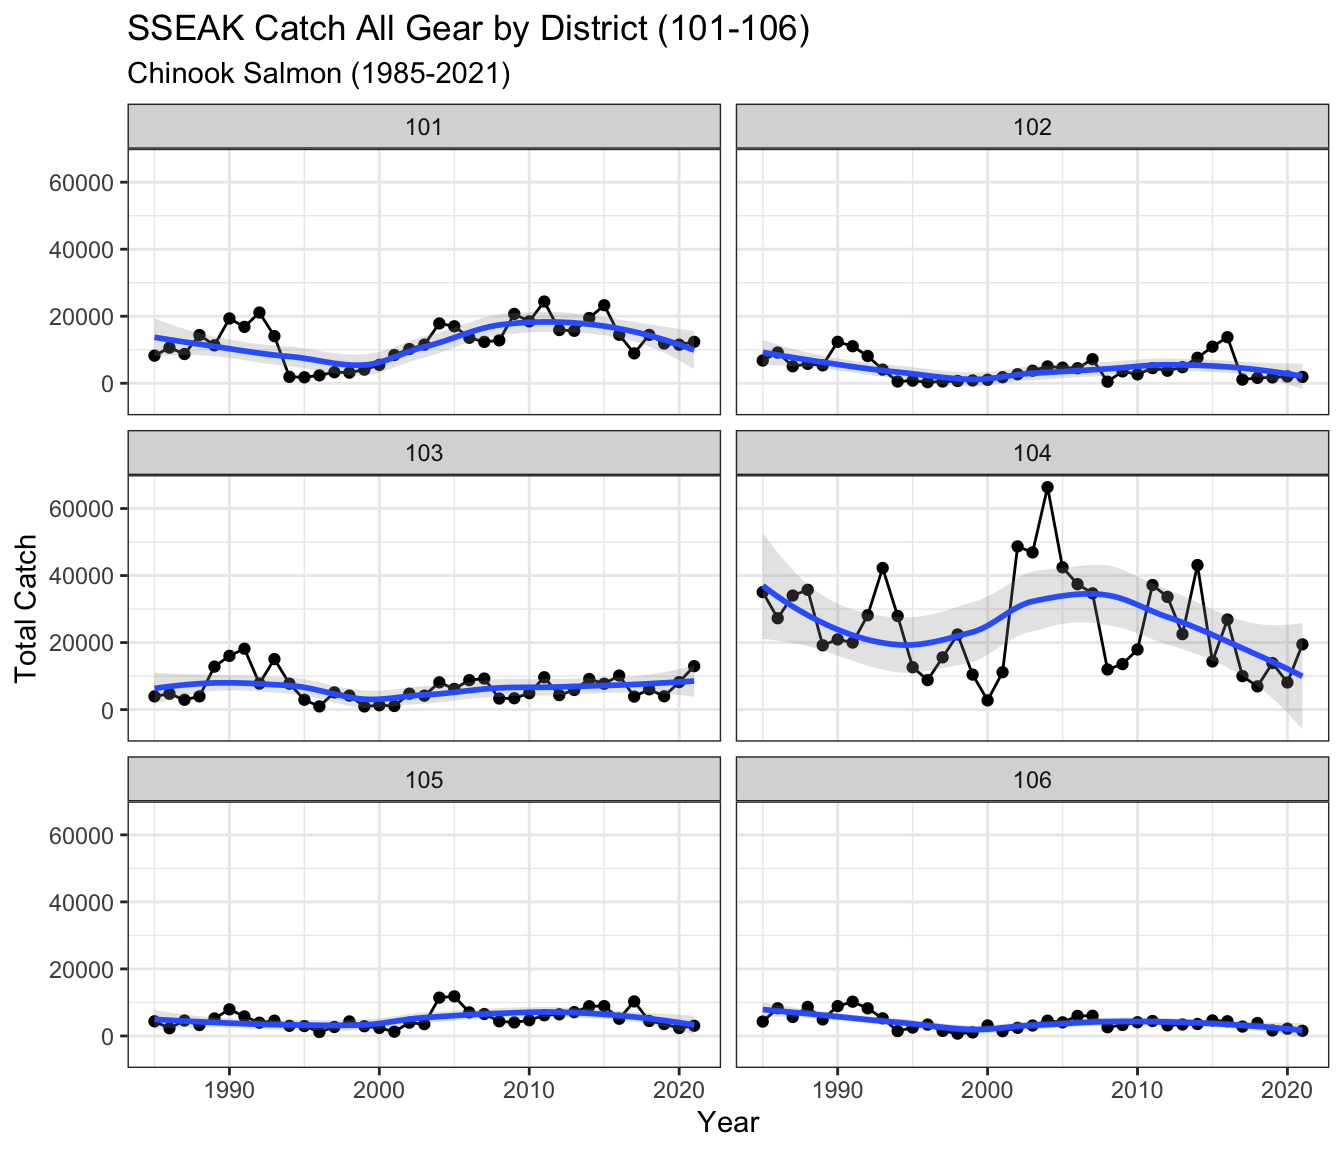
Total catches (all gears) in District 104 is highly variable but has declined substantially since around 2000 (Figure 21). The last few years have seen relatively low catches at less than or around 20,000. District 101 catch has remained relatively constant since increasing in the 90s. Catch in District 104 was higher than in the last 4 years in 2021.
Canadian and SEAK exploitation rates for north and central coast BC Chinook Areas with data are shown in Figure 22. Area 9S refers to Area 9 Summer Chinook, and Area 9W refers to Wannock Chinook. Canadian exploitation rates have been variable, but in general have remained relatively constant (Areas 3, 6, 9W, and 9S), increased (Area 8) or decreased (Area 10). There is little recent data for Area 10, and Area 8 ERs are likely driven by catch of enhanced Atnarko River Chinook. SEAK ERs have increased (9W and 9S), averaged about the same (Areas 3, 4, and 6), or decreased (Areas 8 and 10) over time. Area 4 ERs were historically the highest, averaging around ~40-50%, dropped in the late 90s and in recent years have averaged between 10 and 20%. SEAK ERs range from near 0 to close to 40% in some Areas (Area 9W and 9S in recent years).
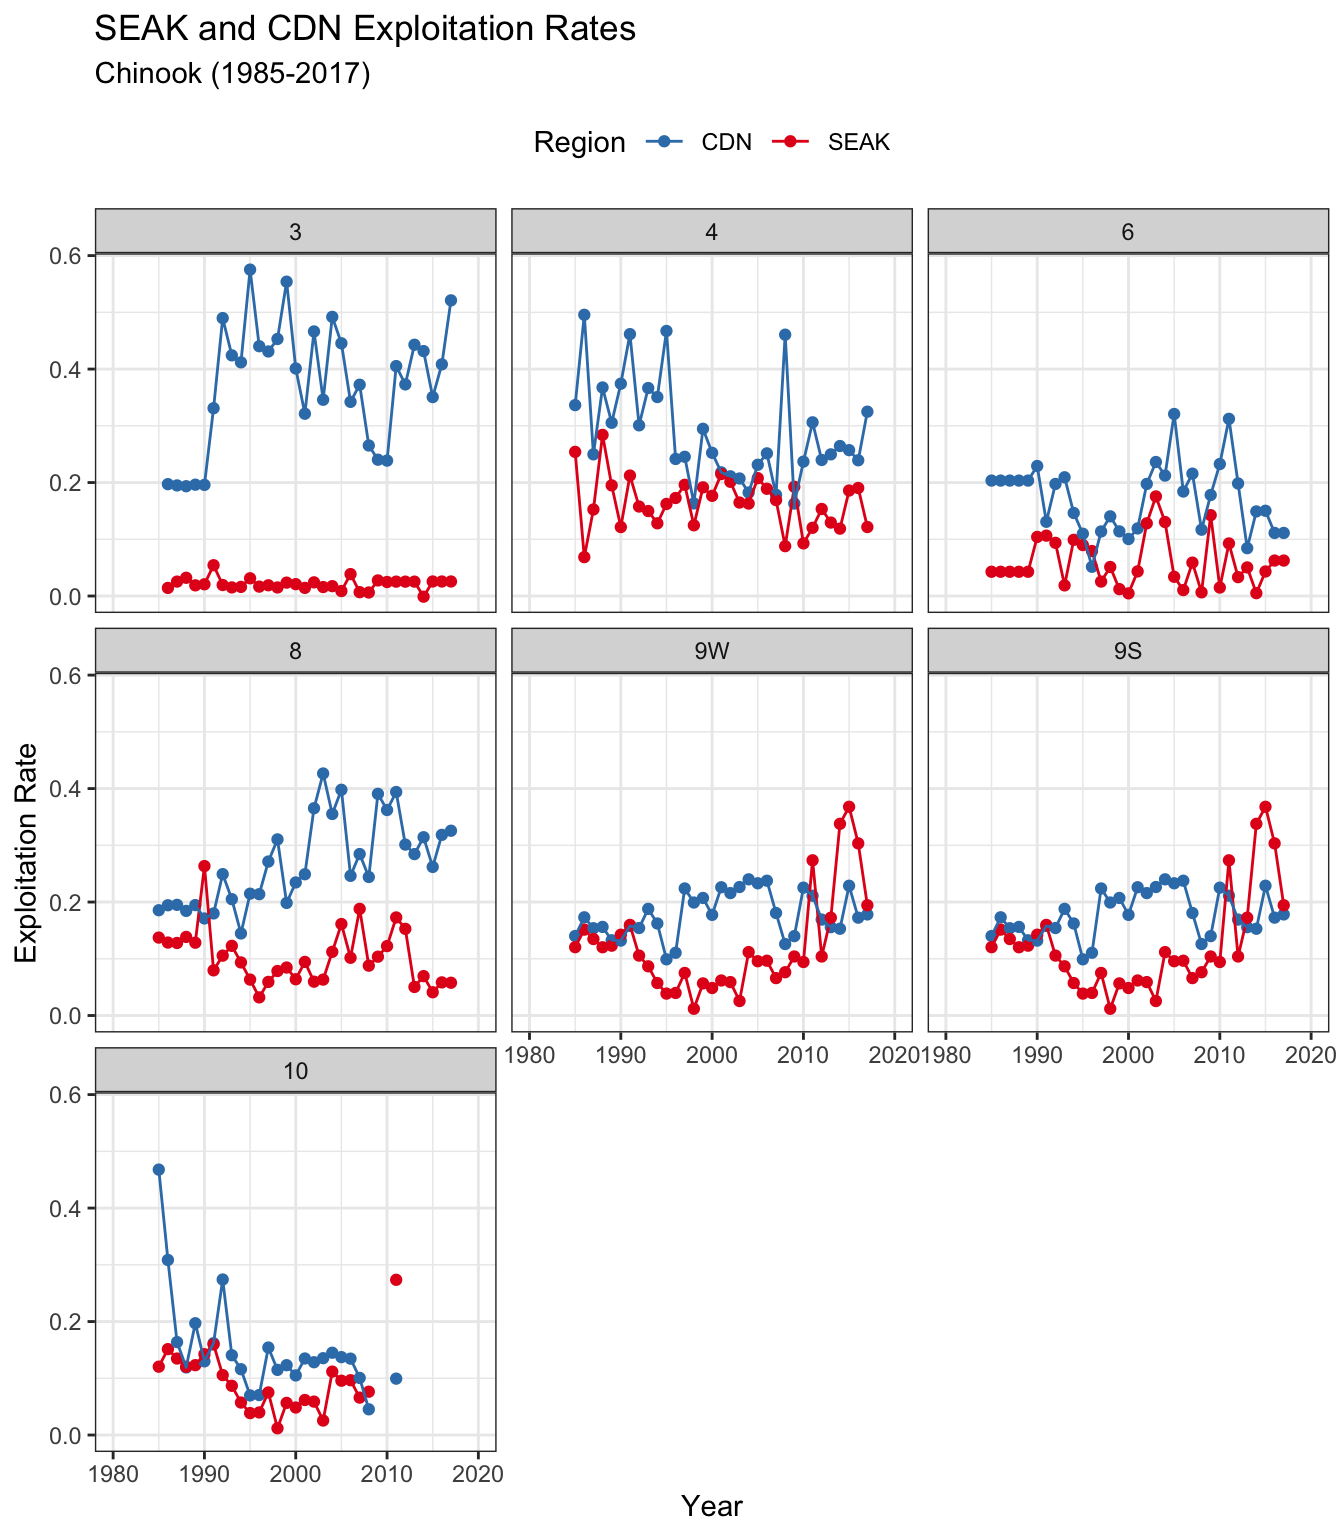
Figure 23 shows SEAK ERs over time by CU for Skeena, Central Coast, and Nass CUs. There is some variation in trends between CUs, however following Area specific SEAK ERs, there are substantial increases in SEAK ERs in recent years in Rivers Inlet and Wannock Chinook CUs. In Skeena CUs, SEAK ER has declined slightly in Lower Skeena and Middle Skeena (large lakes and mainstem tributaries) CUs, while it has remained relatively steady in the Kalum, Ecstall, and Upper Bulkley CUs.
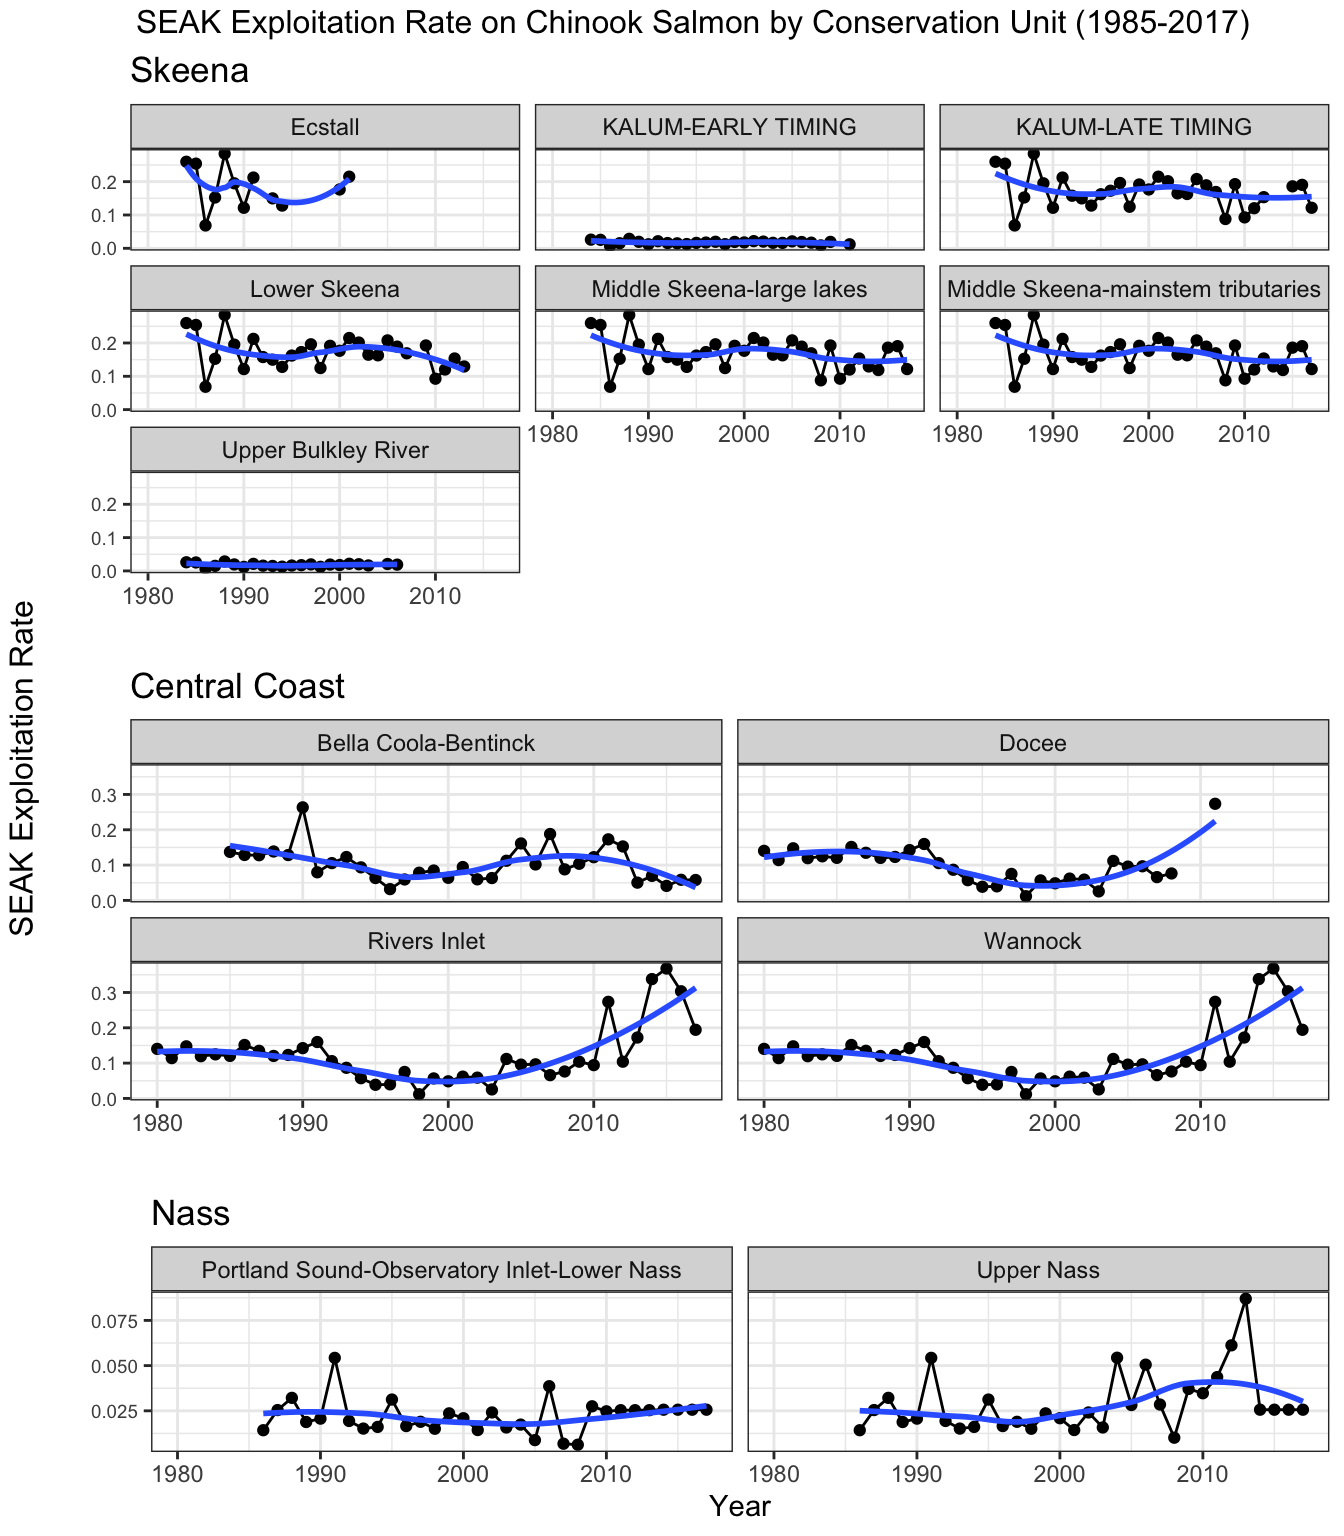
Figure 24 shows total SEAK ERs by year for Canadian CTC Chinook indicator stocks (excluding Transboundary systems). Total SEAK ERs have trended lower in recent years for most stocks, with the exception of Puntledge River, which increased slightly in the 2000s and has remained relatively stable since. Note that the Phillips and Middle Shuswap stocks have short time series (< 10 years).
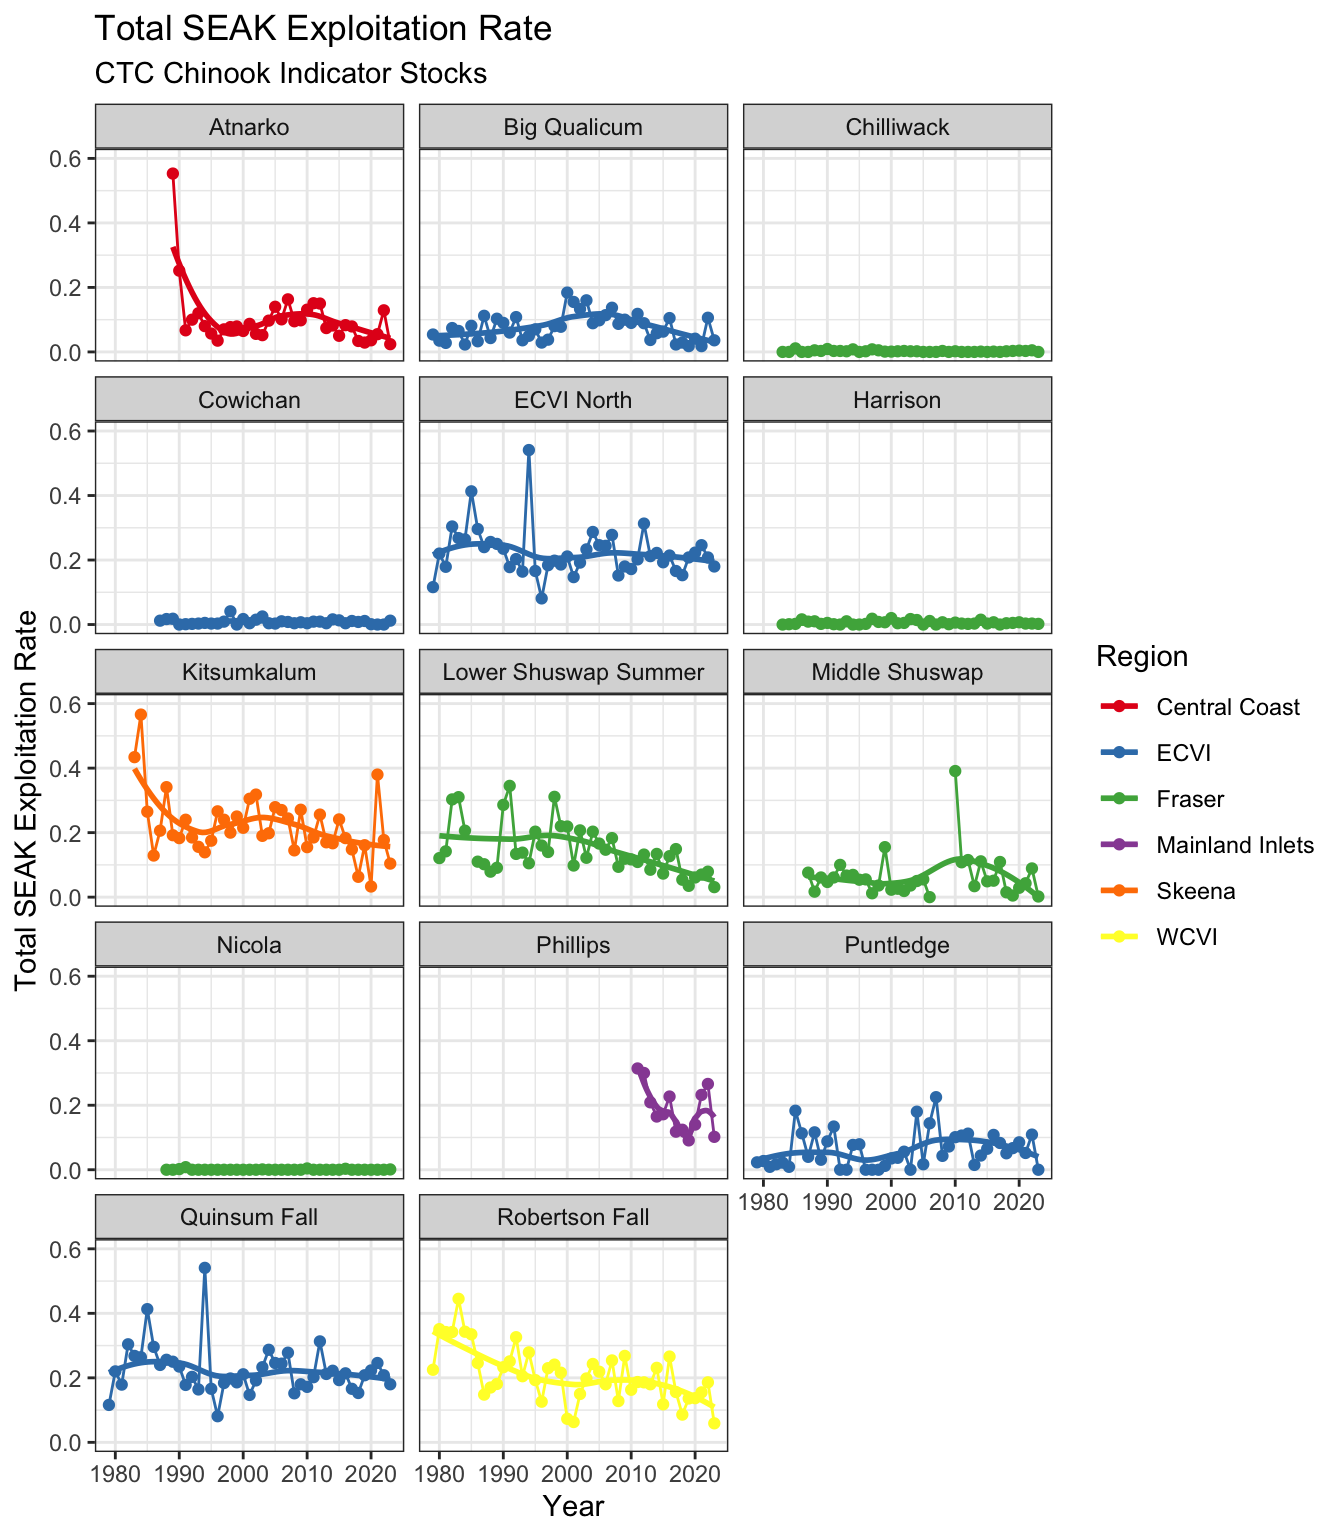
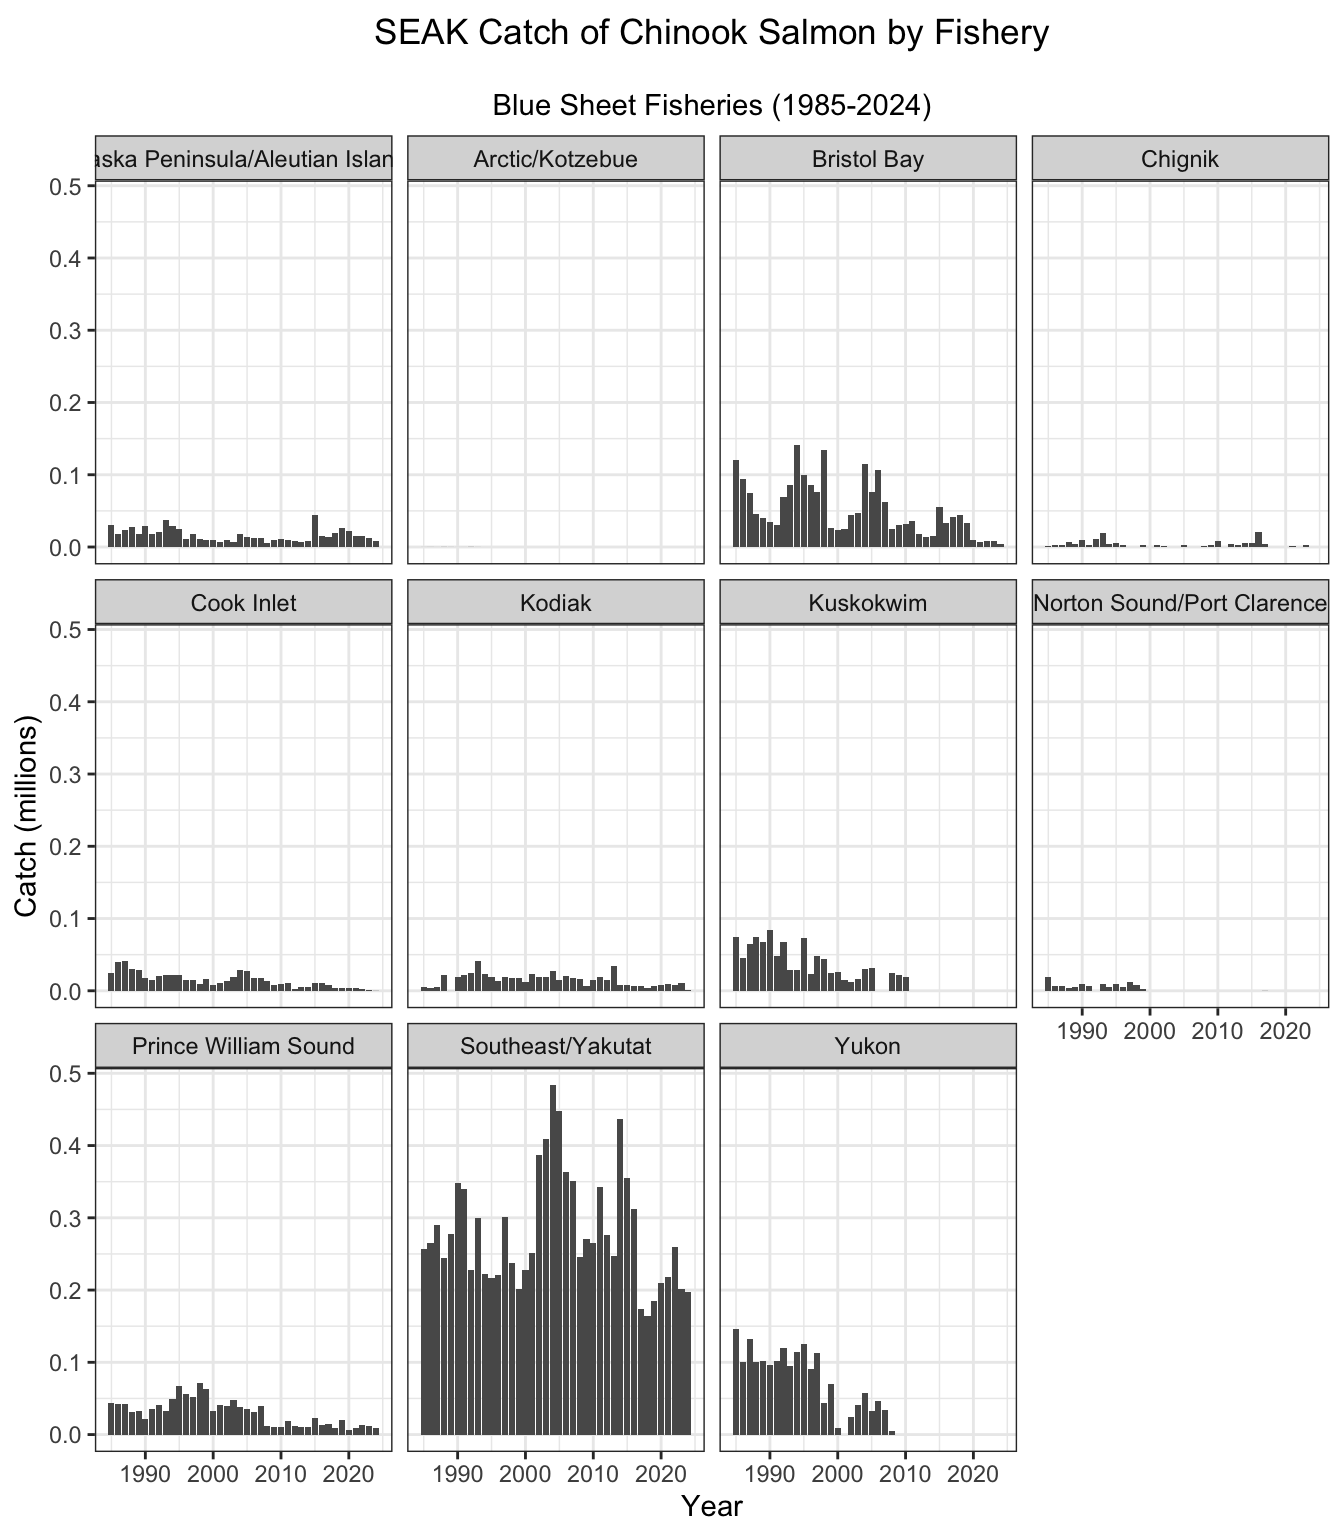
Figure 25 shows the harvest of Chinook salmon by “Blue Sheet” fishery for 1979-2024. Chinook salmon are primarily caught in the Southeast/Yakutat, Bristol Bay, Yukon, and Kuskokwim fisheries although catch declined significantly in the Yukon and Kuskokwim fisheries since 2010. Chinook are also caught in the Alaska Peninsula/Aleutian Islands, Kodiak, Prince William Sound, Cook Inlet, and Chignik fisheries.
Coho
Canadian and SEAK exploitation rates for north and central coast BC coho are shown by Statistical Unit in Figure 26. In Areas 5-10, Canadian exploitation rates have dropped dramatically in the late 90s following decreased marine survival and the coho crisis which severely curtailed most fisheries. For Areas 2E, 2W, and 3, Canadian ERs dropped in the late 90s, but appear to be close to historical levels in some recent years (~20%). Area 4 ERs were historically the highest, averaging around ~40-50%, dropped in the late 90s and in recent years have averaged between 10 and 20%.
SEAK ERs are estimated to be highest for Area 3 coho production (averaging around 30-40% with some years over 50%), slightly lower in Area 4 and Area 6 (same ER as Area 4), and much lower for the rest of the areas. SEAK ERs on Haida Gwaii (Areas 2E and 2W) are very low, averaging around 2-4%.
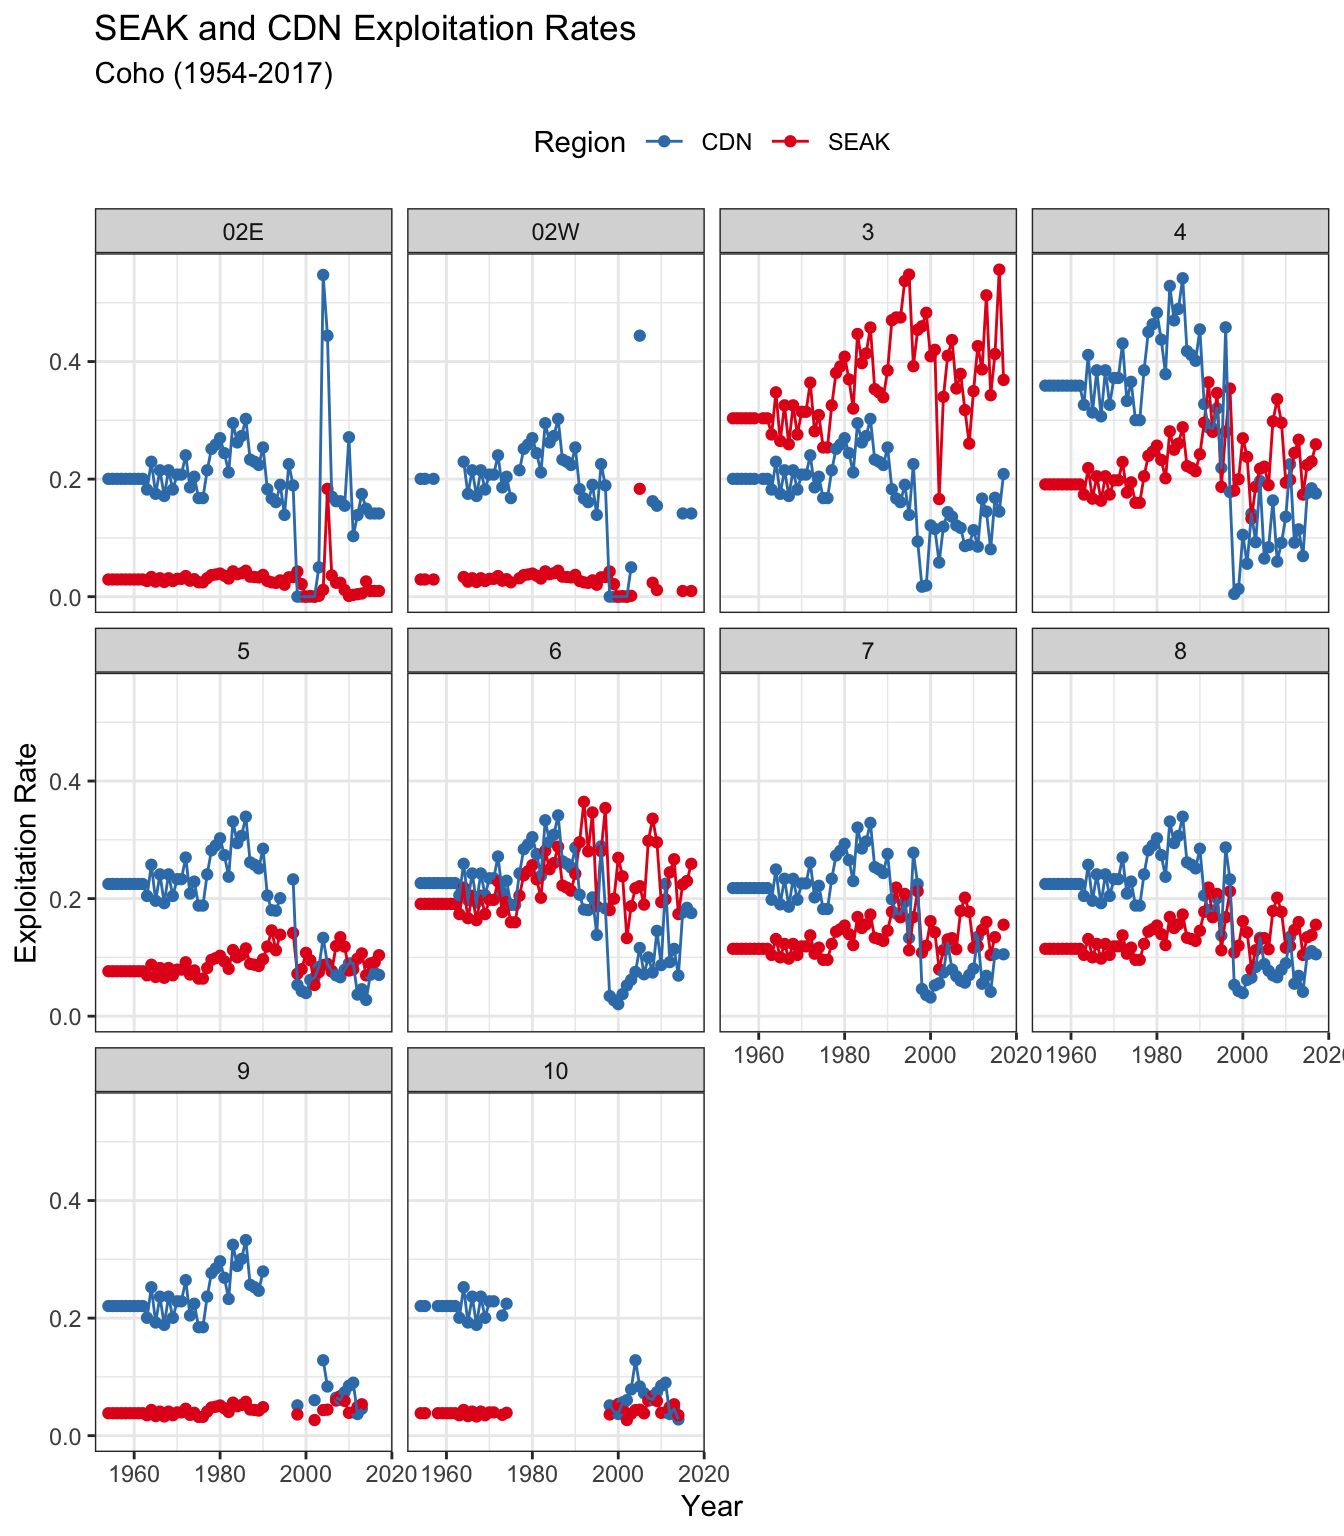
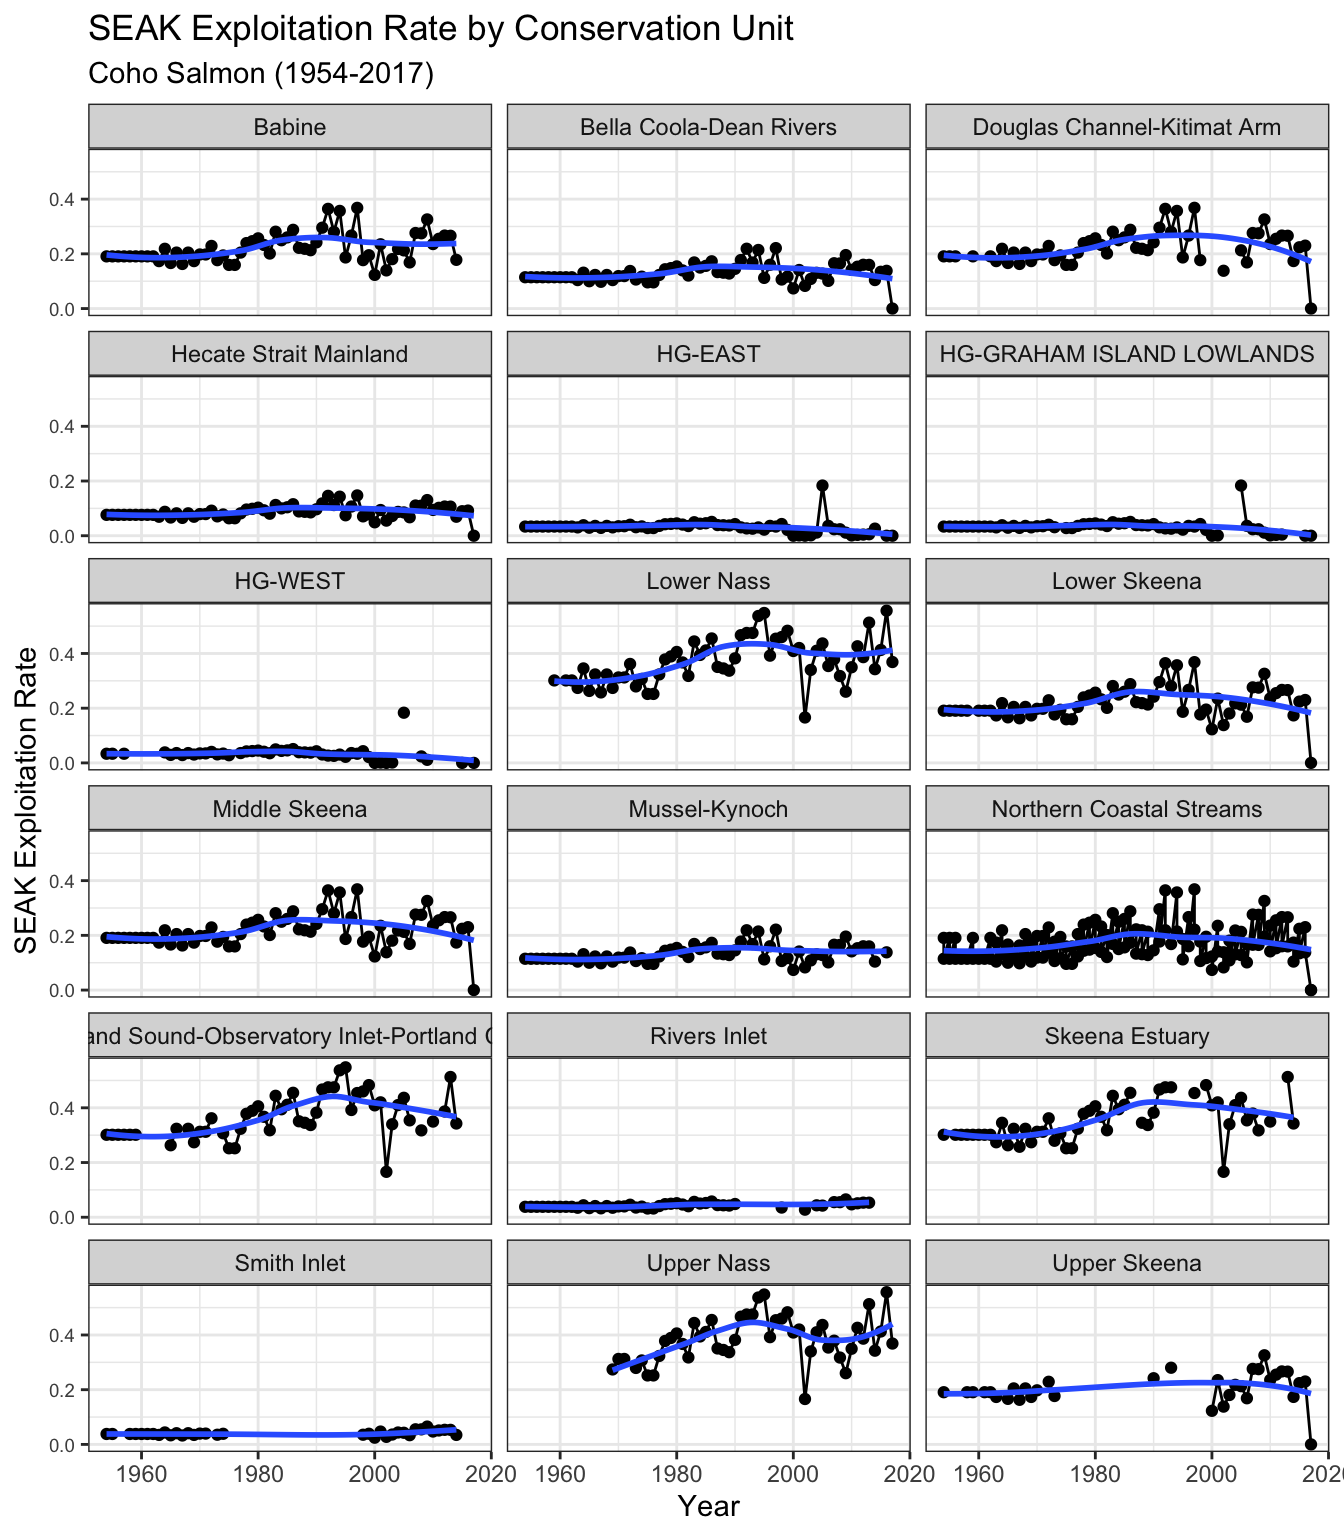
Figure 27 shows SEAK ERs over time by CU for north and central coast CUs. There is some variation in trends between CUs, but CUs show stable, slightly increasing, or slightly decreasing SEAK ERs in recent years. SEAK ERs for north and central coast CUs follow the same patterns as their respective indicator estimates, therefore the proportion of catch attributed to SEAK fisheries is high for Skeena and Nass CUs, and moderate for central coast CUs. This means that these estimates suggest that SEAK catch has been higher in recent years than Canadian catch, and some times by 3-fold (Nass).
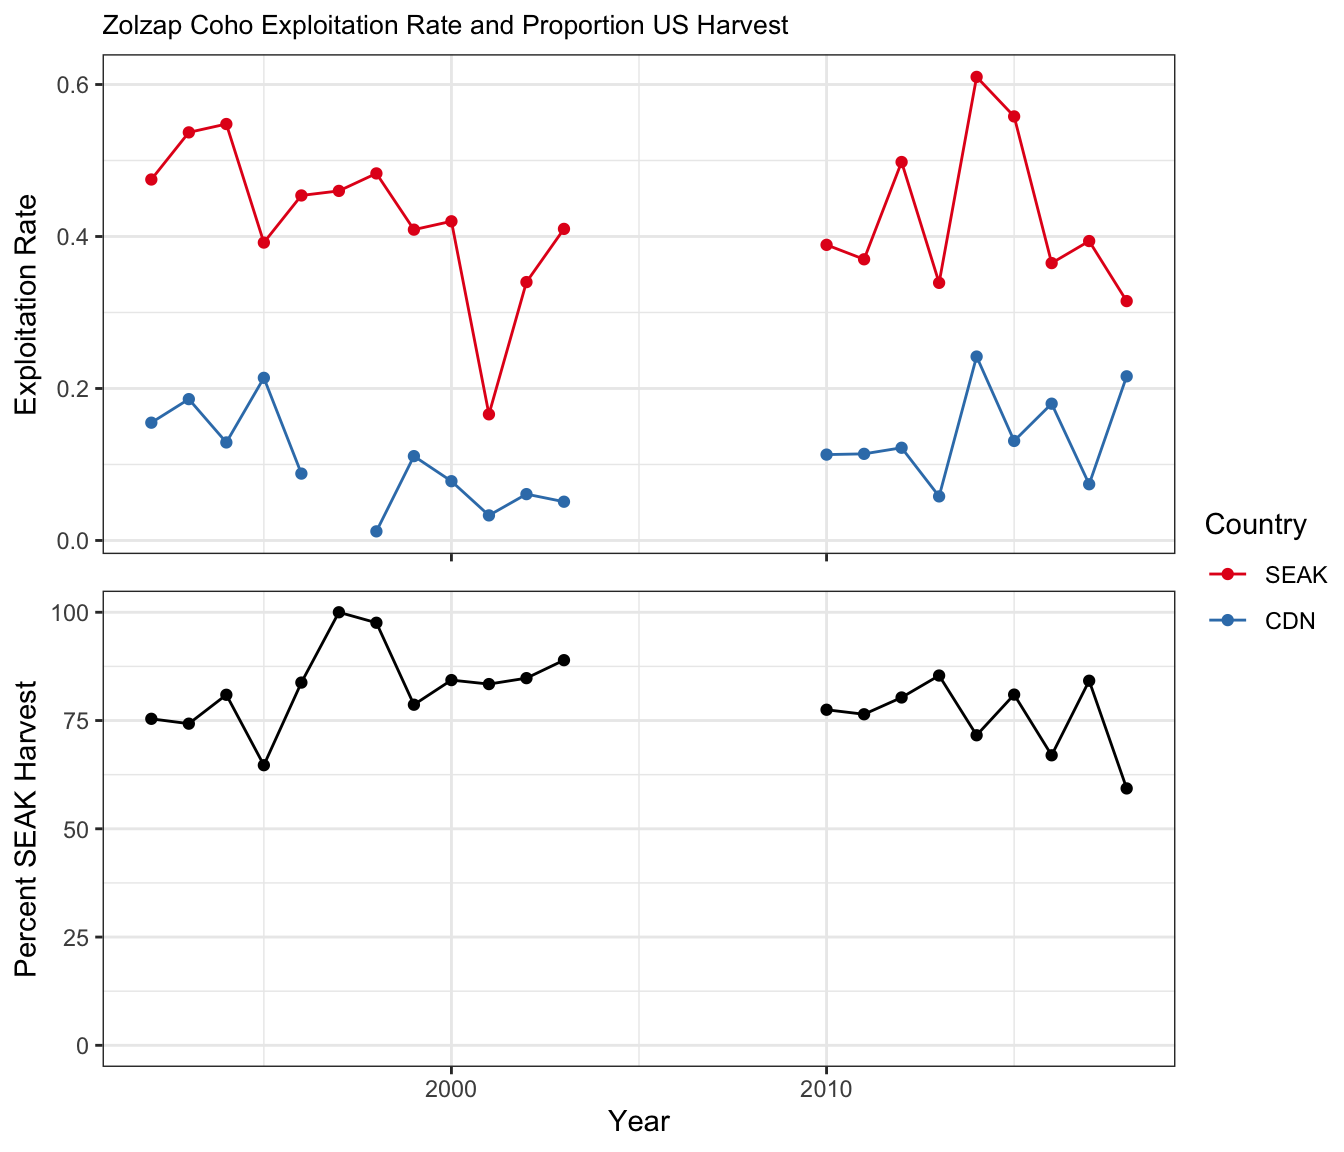
Information on Canadian and SEAK catch specifically of Zolzap Creek coho for 1992-2005 and 2010- 2018 was provided by LGL (2021b) and in a draft report (Noble et al. 2020). This is similar to the Area 3 data as the Zolzap system is the indicator system for the Area 3 (Nass). This was the only system level data we were able to procure before the writing of this report. SEAK ERs range from over 60% to less than 20%, but average around 40% over the time series, much higher than Canadian ERs (Figure 28). The proportion of total ER attributed to SEAK ranges from ~ 60% in 2018 to 100% in 1997, but averages around 75%.
Weitkamp and Neely (2011) provide an excellent analysis of ocean migration patterns from CWT recoveries of hatchery and wild coho from Alaska to California. Figure 29 (Figure 2 from Weitkamp and Neely 2011), provides an overview of the recovery patterns for tagged coho. Key findings of this analysis are that north BC coast CWT coho are recovered in approximately equal numbers in north and south SEAK fisheries and north BC coast and Haida Gwaii fisheries. There are no central coast hatcheries. Haida Gwaii origin fish are mostly recovered in north BC and Haida Gwaii, and there are very few recoveries of WCVI, ECVI, south mainland, lower or upper Fraser coho in SEAK. This provides support for both the high SEAK ERs in north coast coho, and the low SEAK ERs for southern stocks. Weitkamp and Neely (2011) also determine that CWT’d tagged wild coho follow relatively similar patterns of marine distribution as their specific regional hatchery indicators, suggesting that SEAK ERs would be similar for wild coho as hatchery indicators.
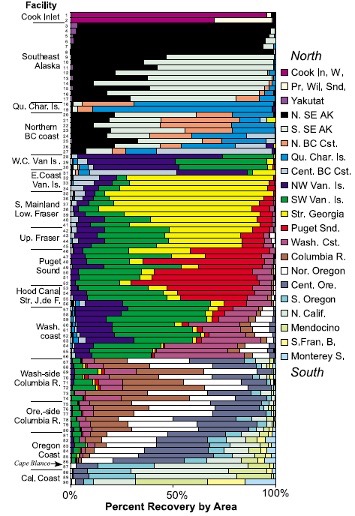
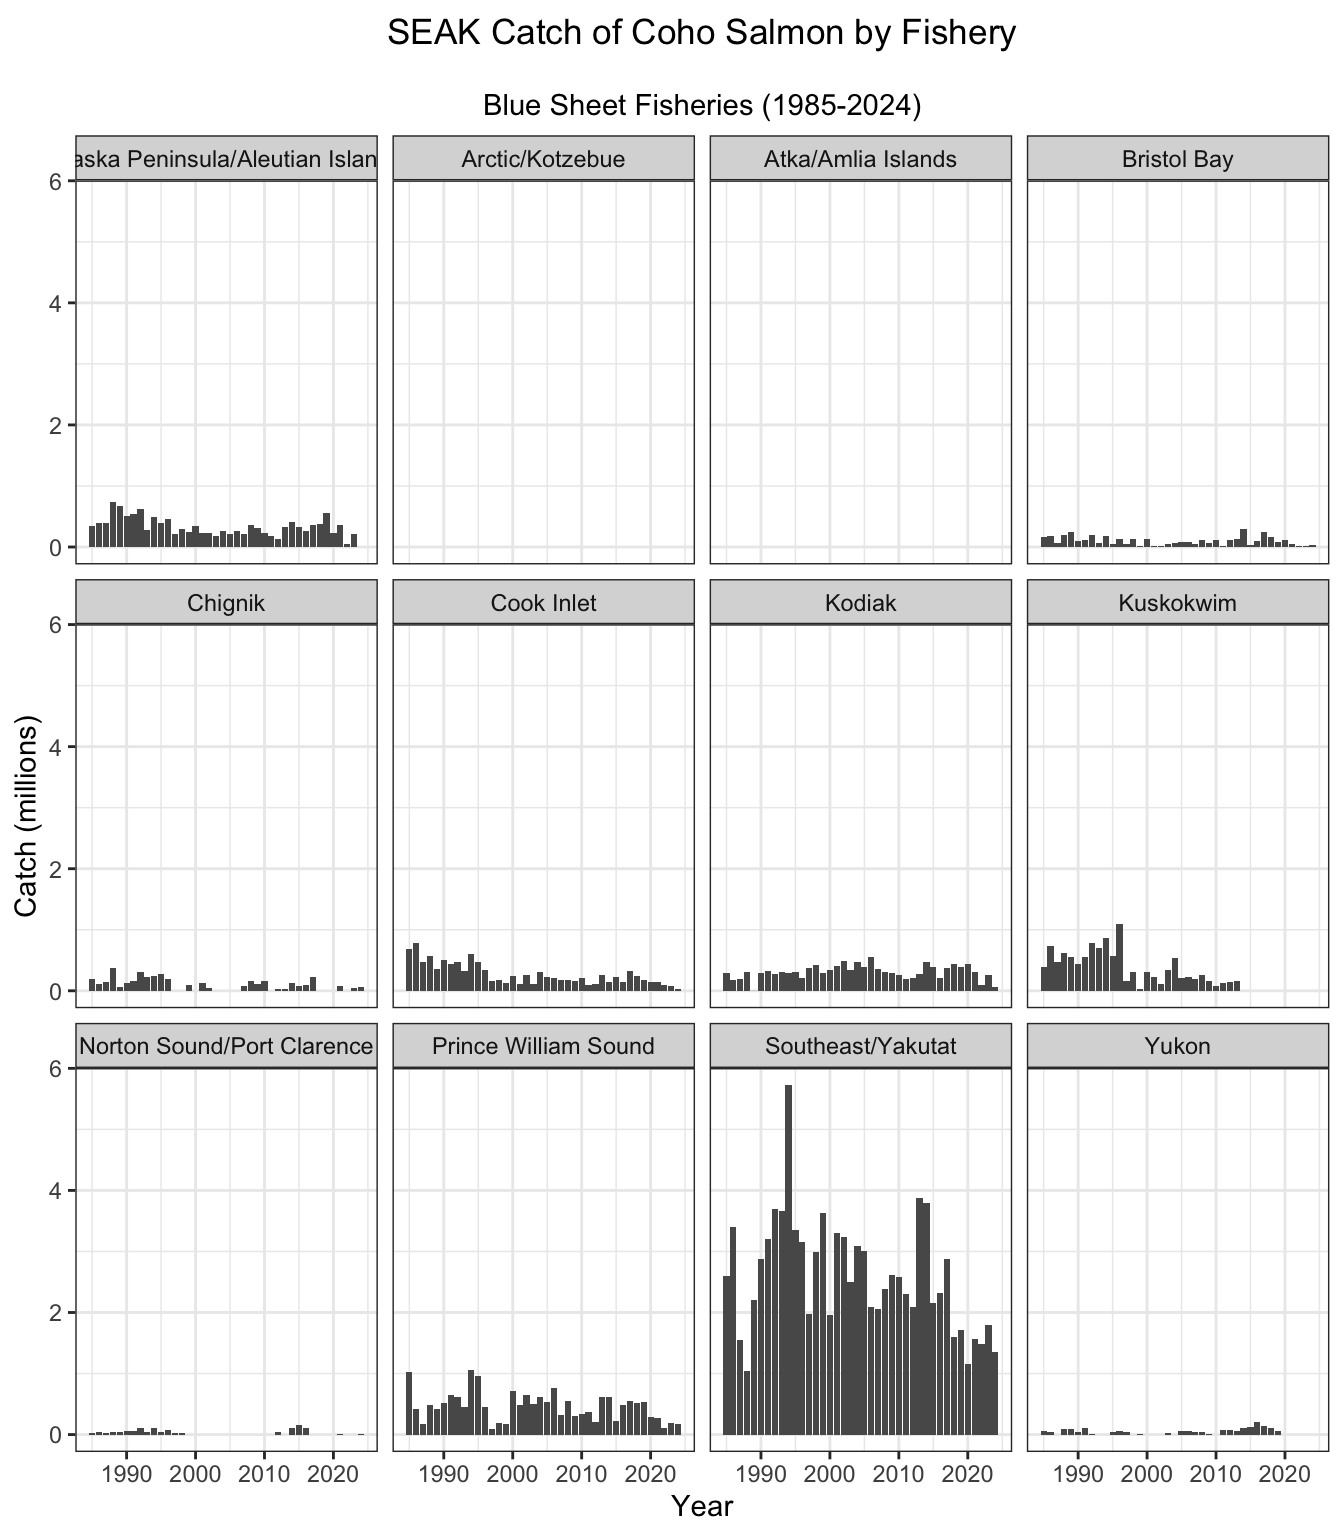
Figure 30 shows the harvest of coho salmon by “Blue Sheet” fishery for 1979-2024. Coho salmon are primarily caught in the Southeast/Yakutat, Alaska Peninsula/Aleutian Islands, Prince William Sound, Kodiak, and Cook Inlet fisheries, as well as in smaller numbers in the Bristol Bay, Koskokwim, Chignik, Norton Sound/Port Clarence, and Yukon fisheries.
Chum
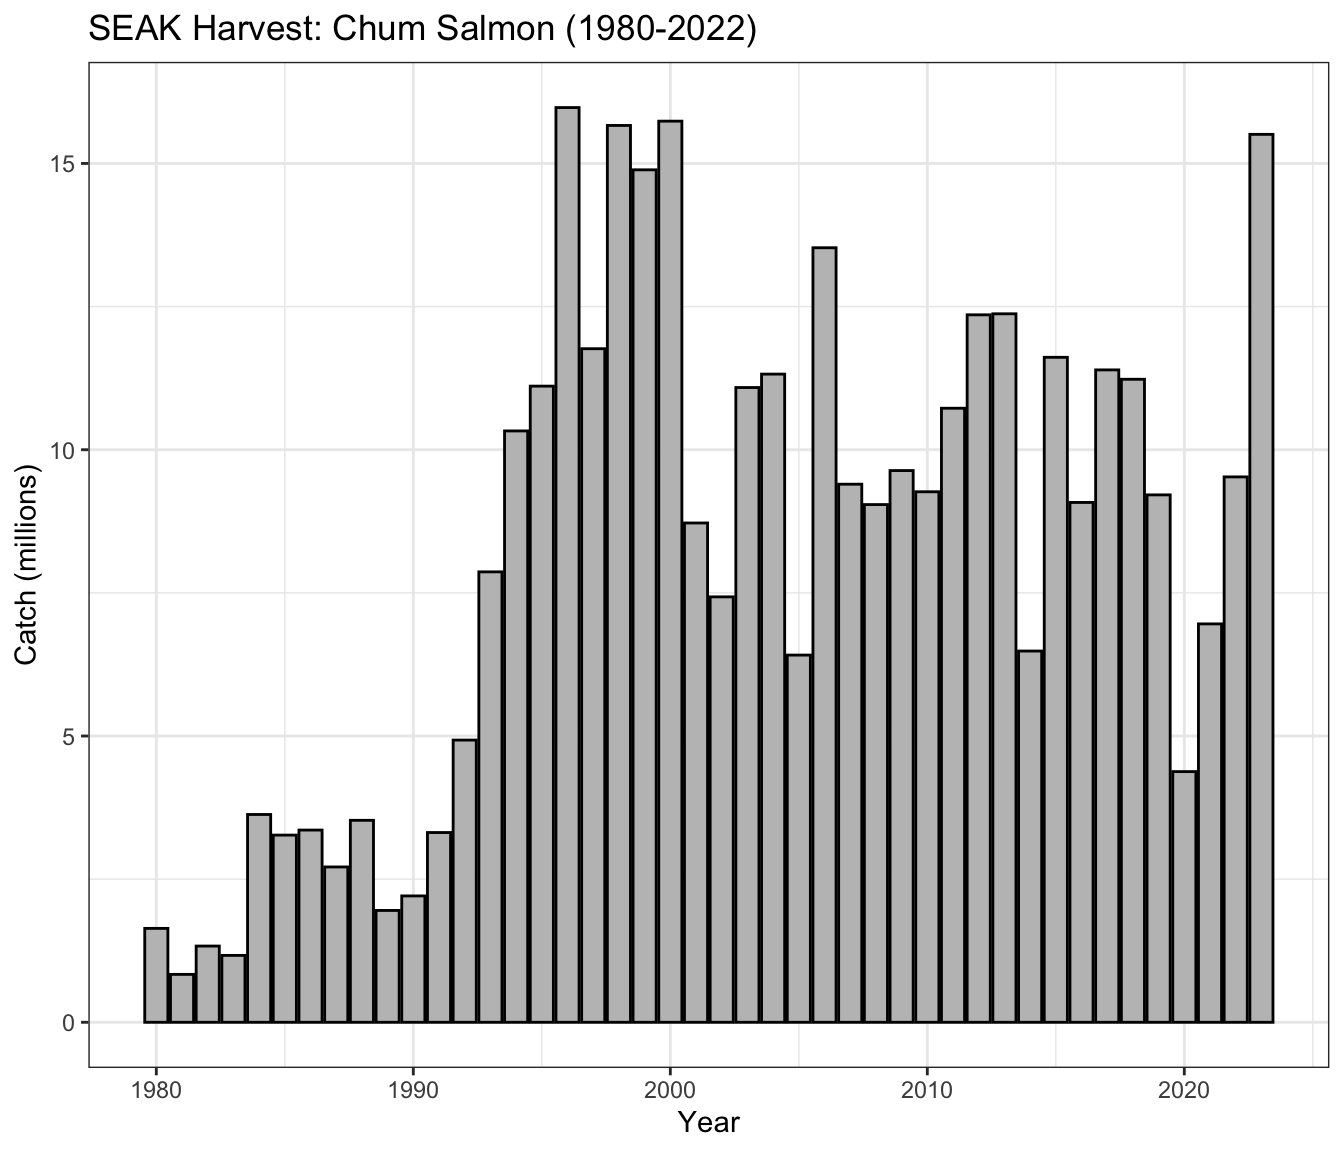
Total chum salmon catch in SEAK between 1980 and 2022 ramped up in the early 90s following investments in large scale enhancement in Alaska, has averaged nearly 10 million since (Figure 31). Since 2010, catches have averaged just under ~ 10 million chum per year. Total SEAK catch of chum in 2022 was over 15 million chum, a substantial jump from recent averages.
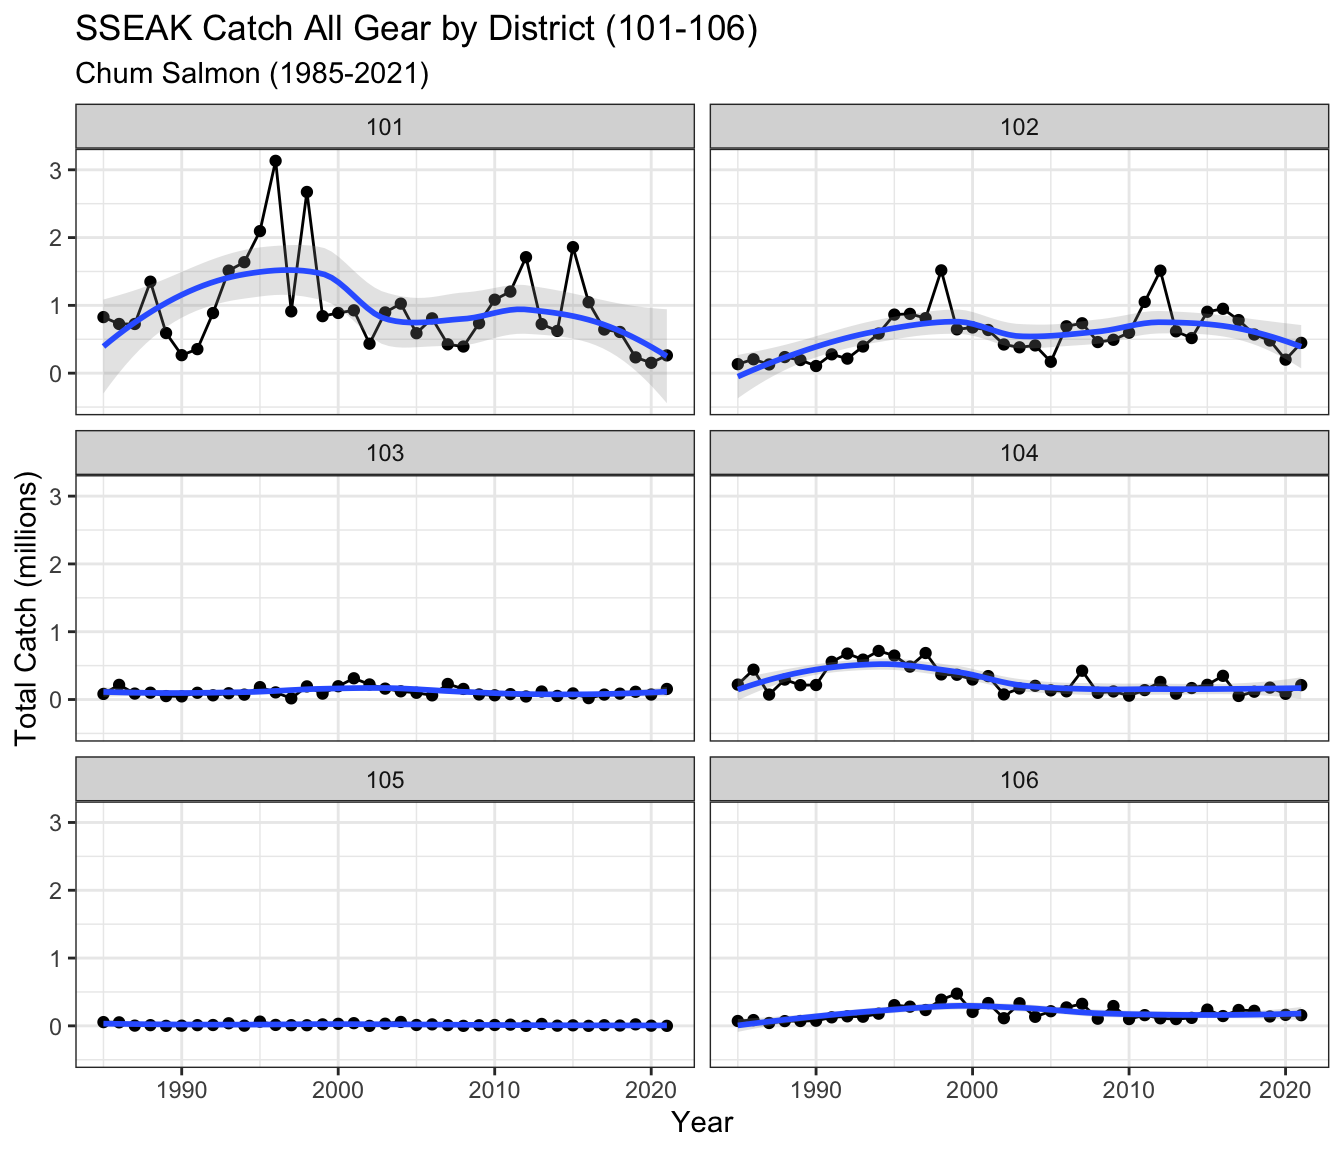
Total catches (all gears) in District 101 is highly variable and since 2000 has ranged from ~ 100,000 to nearly 2 million (Figure 32). The last few years have seen relatively low catches. The District 104 fishery has remained relatively constant and low since the 2000s.
SSEAK and Canadian exploitation rates for north and central coast BC chum salmon are shown in Figure 33. Exploitation rates from SSEAK are only estimated for Areas 3, 4 and 5. Canadian exploitation rates are highly variable and have recently declined to much lower levels than in the historical time period in most Areas (except Area 9 and 10 where recent estimates are not available), and especially in Areas 3, 4 and 5. Following pink salmon exploitation rates, estimated SSEAK exploitation rates on chum salmon have declined slightly since the 80s, but in the last 20 years have averaged around 12% in Areas 3,4 and 5.
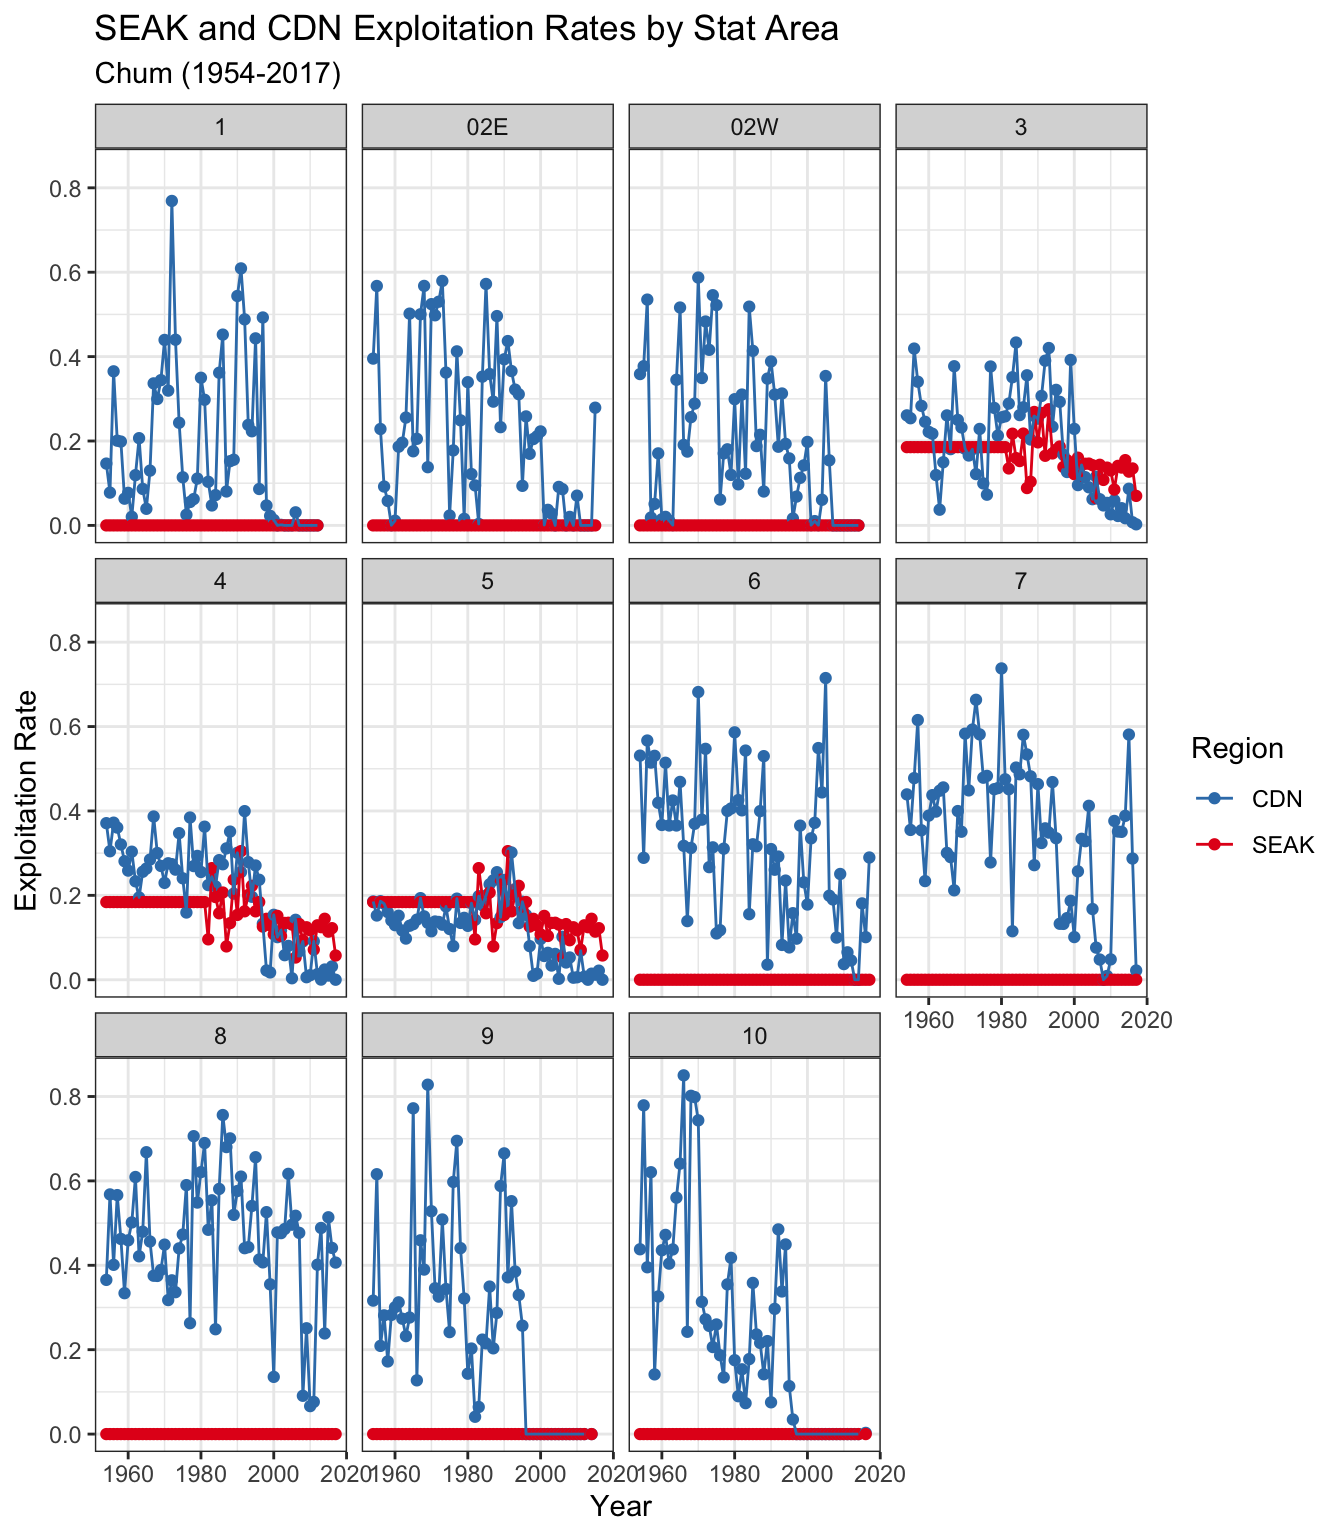
Figure 34 shows SEAK and Canadian exploitation rates for north and central coast BC chum salmon by Conservation Unit. Across all CUs, Canadian ER has declined drastically since the 1990s while SEAK ER has also declined slightly.
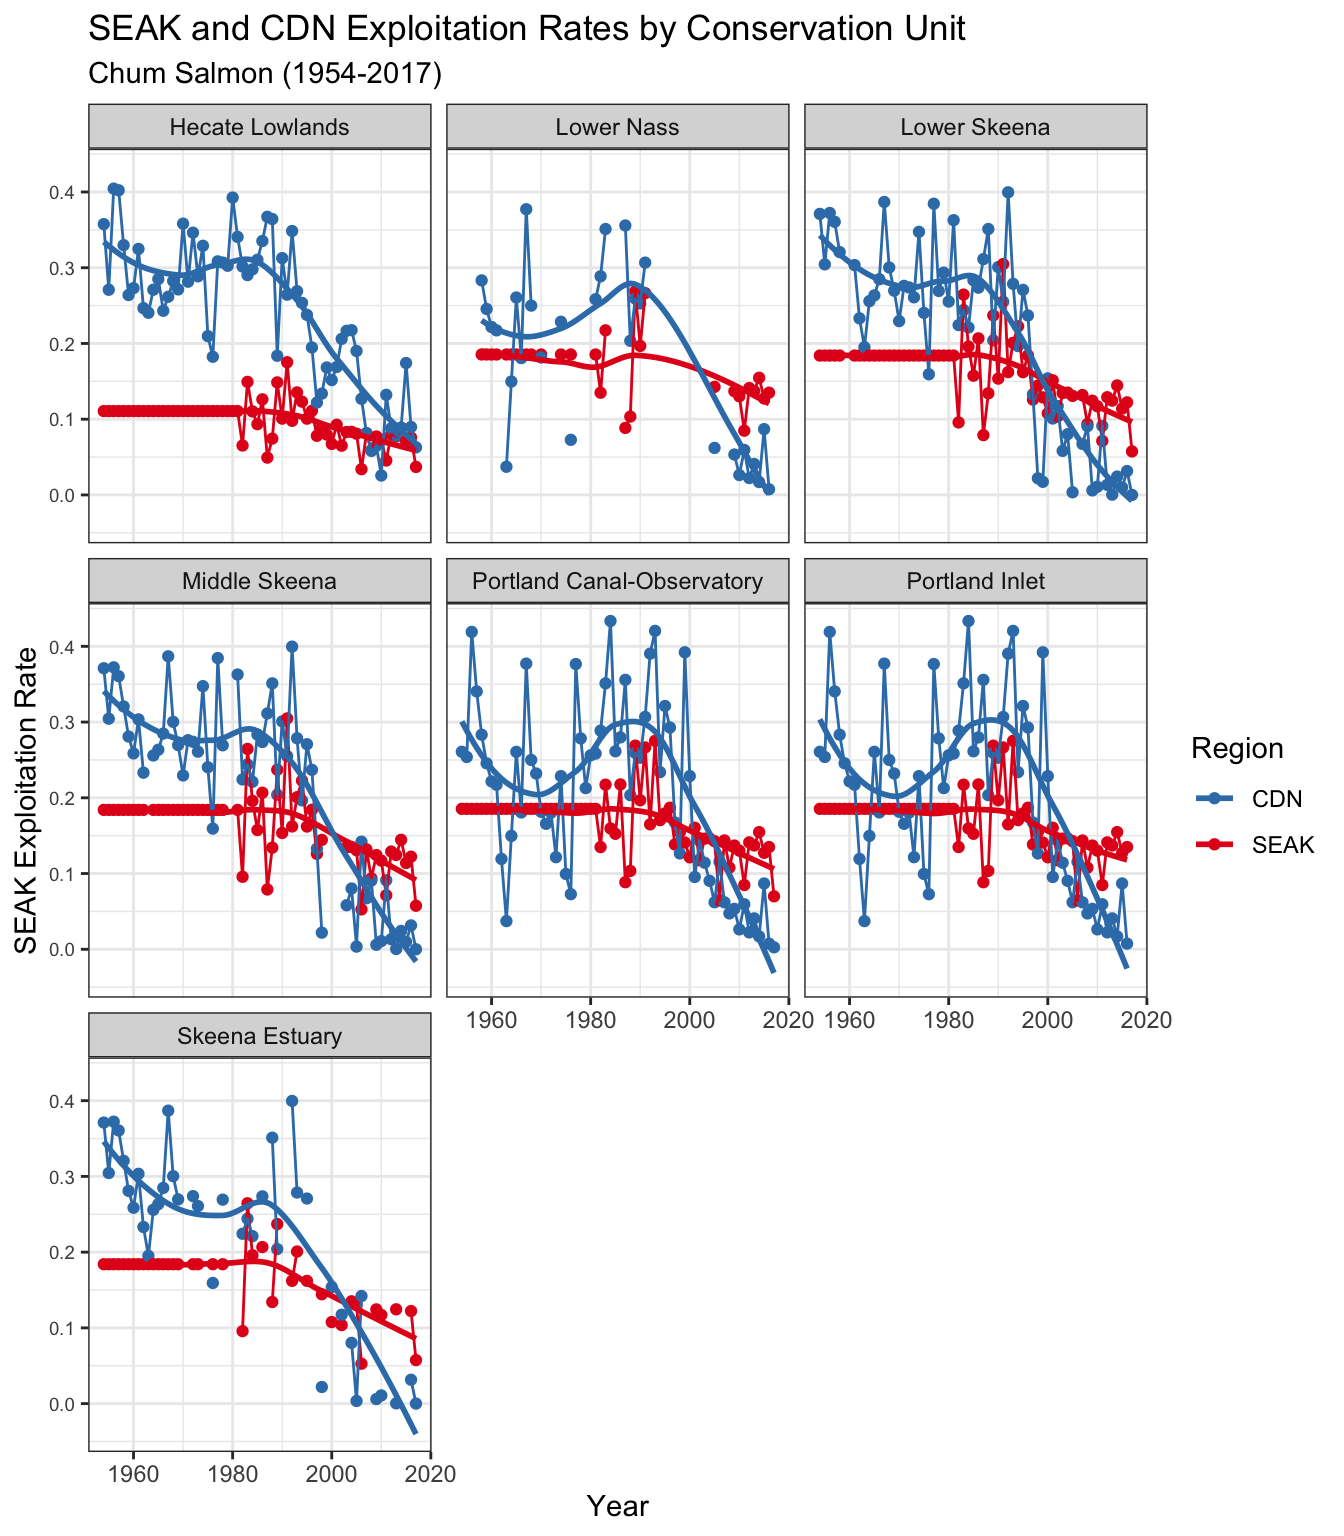
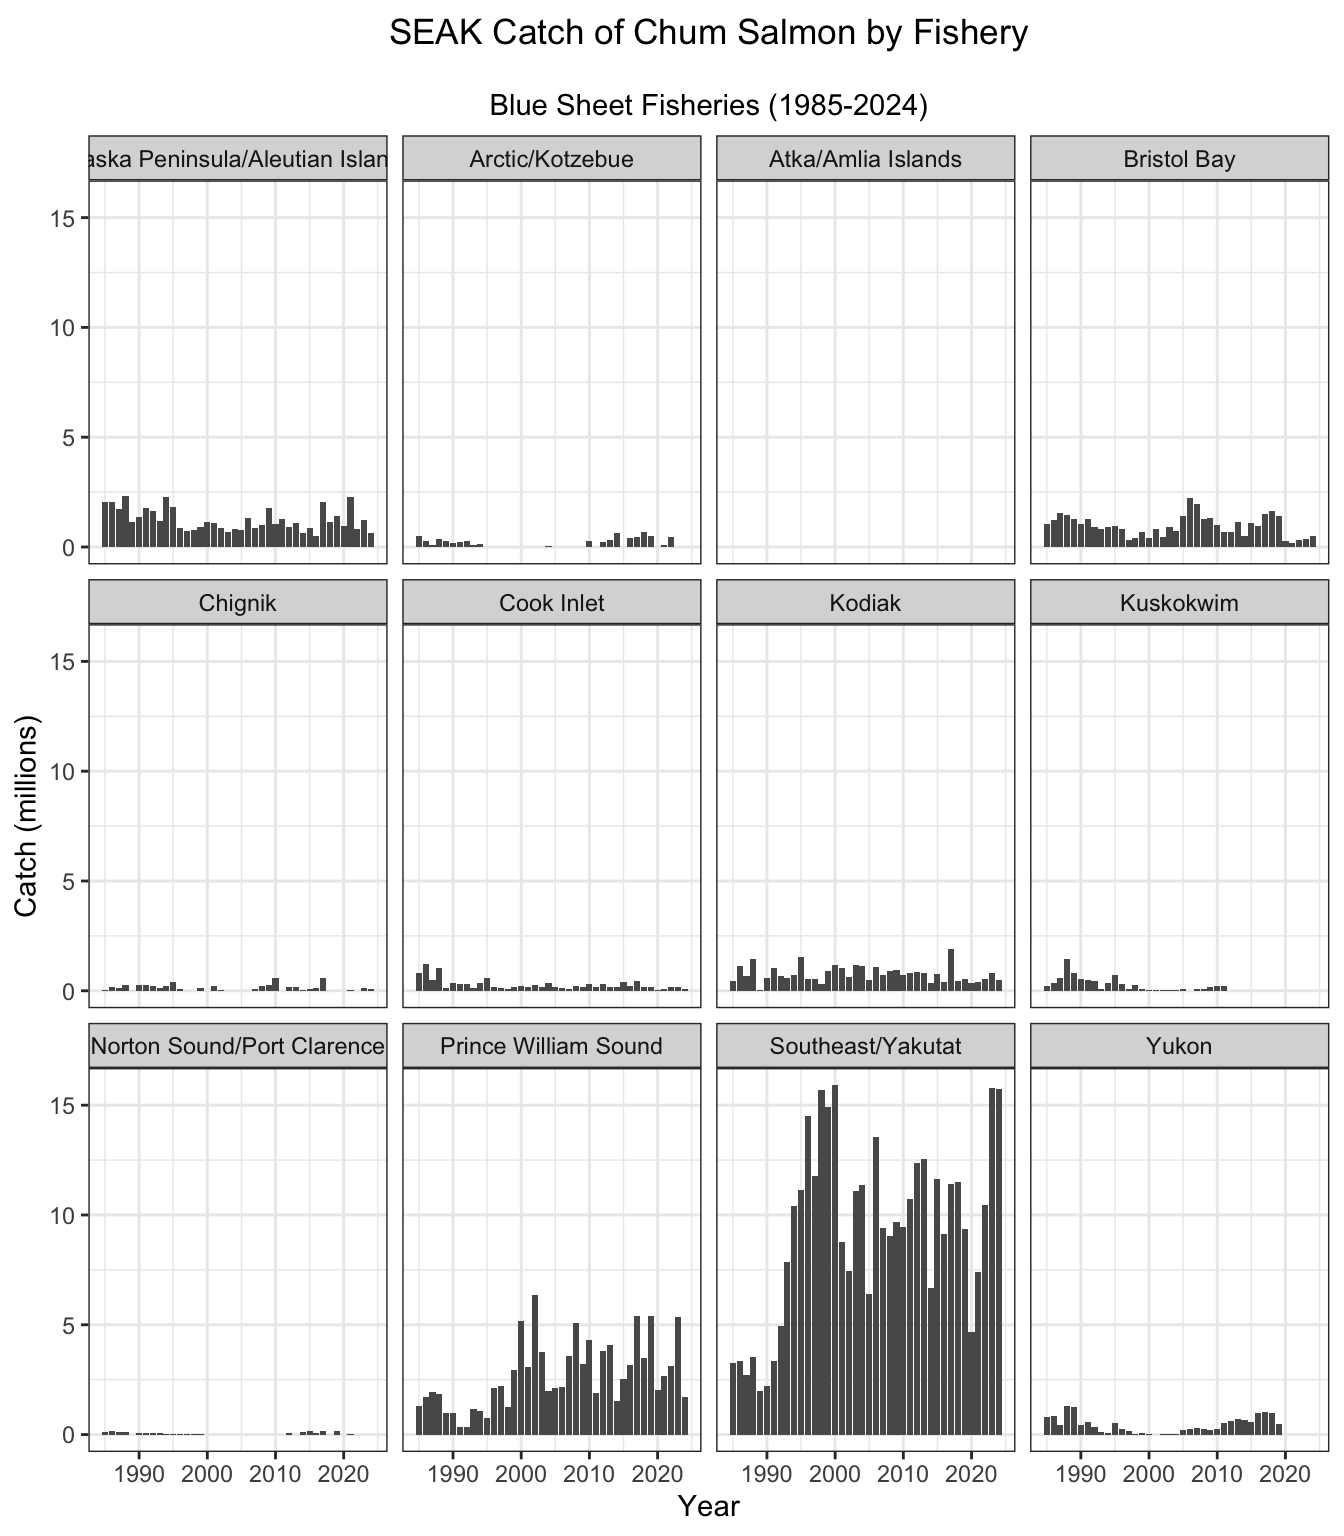
Figure 35 shows the harvest of chum salmon by “Blue Sheet” fishery for 1985-2024. Chum salmon are primarily caught in the Southeast/Yakutat, Prince William Sound, Alaska Peninsula/Aleutian Islands, and Bristol Bay fisheries, as well as the Kodiak, Yukon, Cook Inlet, Kuskokwim, Chignik, and Arctic/Kotzebue fisheries.
Pink
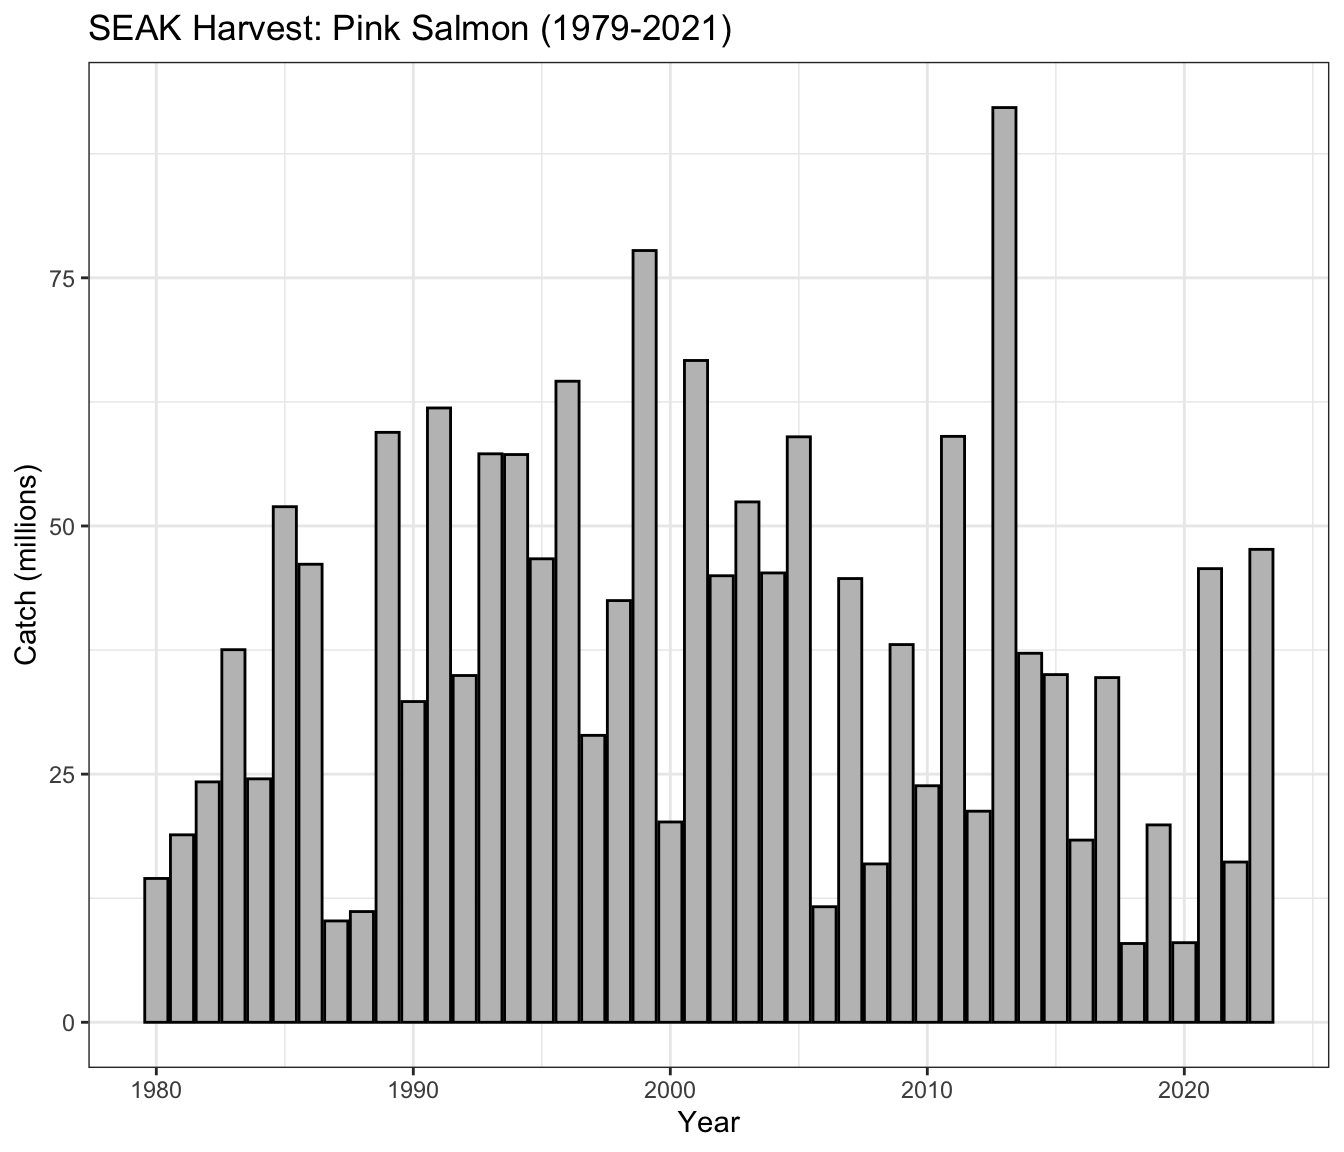
Total pink salmon catch in SEAK between 1979 and 2021 peaked in the mid-90s, averaging ~ 37 million (Figure 36). Since 2010, catches have averaged ~ 32.5 million.
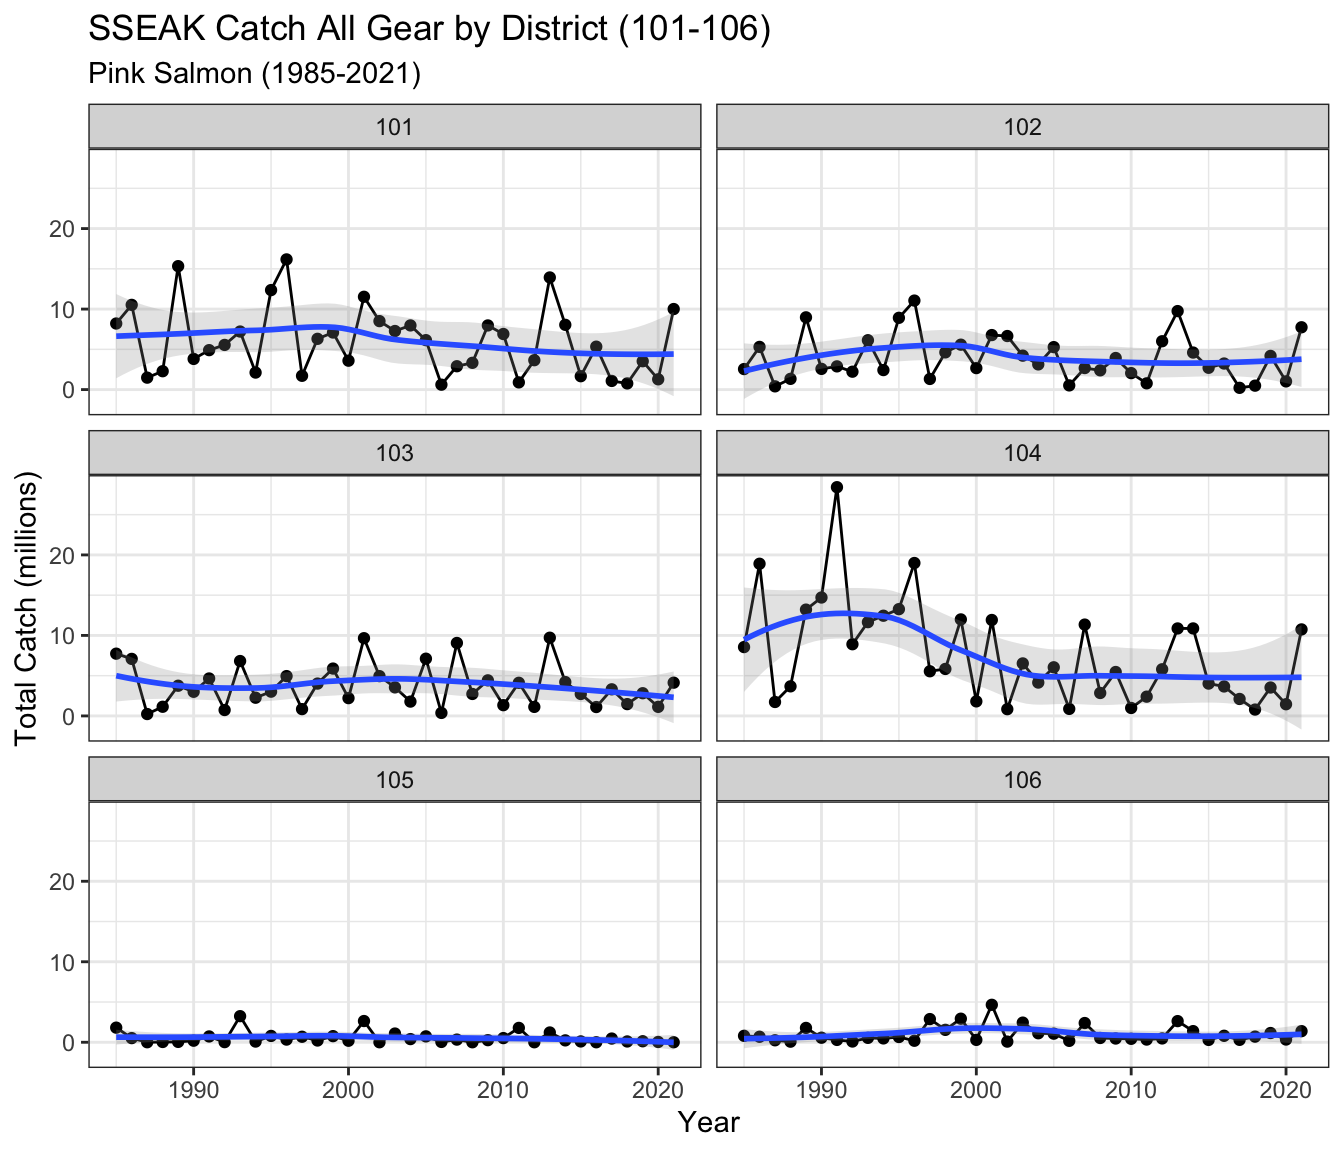
Total catches (all gears) in District 104 in most years has declined since the 90s to an average catch of around 5 million per year in the 2000s (Figure 37). The other Districts have remained variable with no major trends over time.
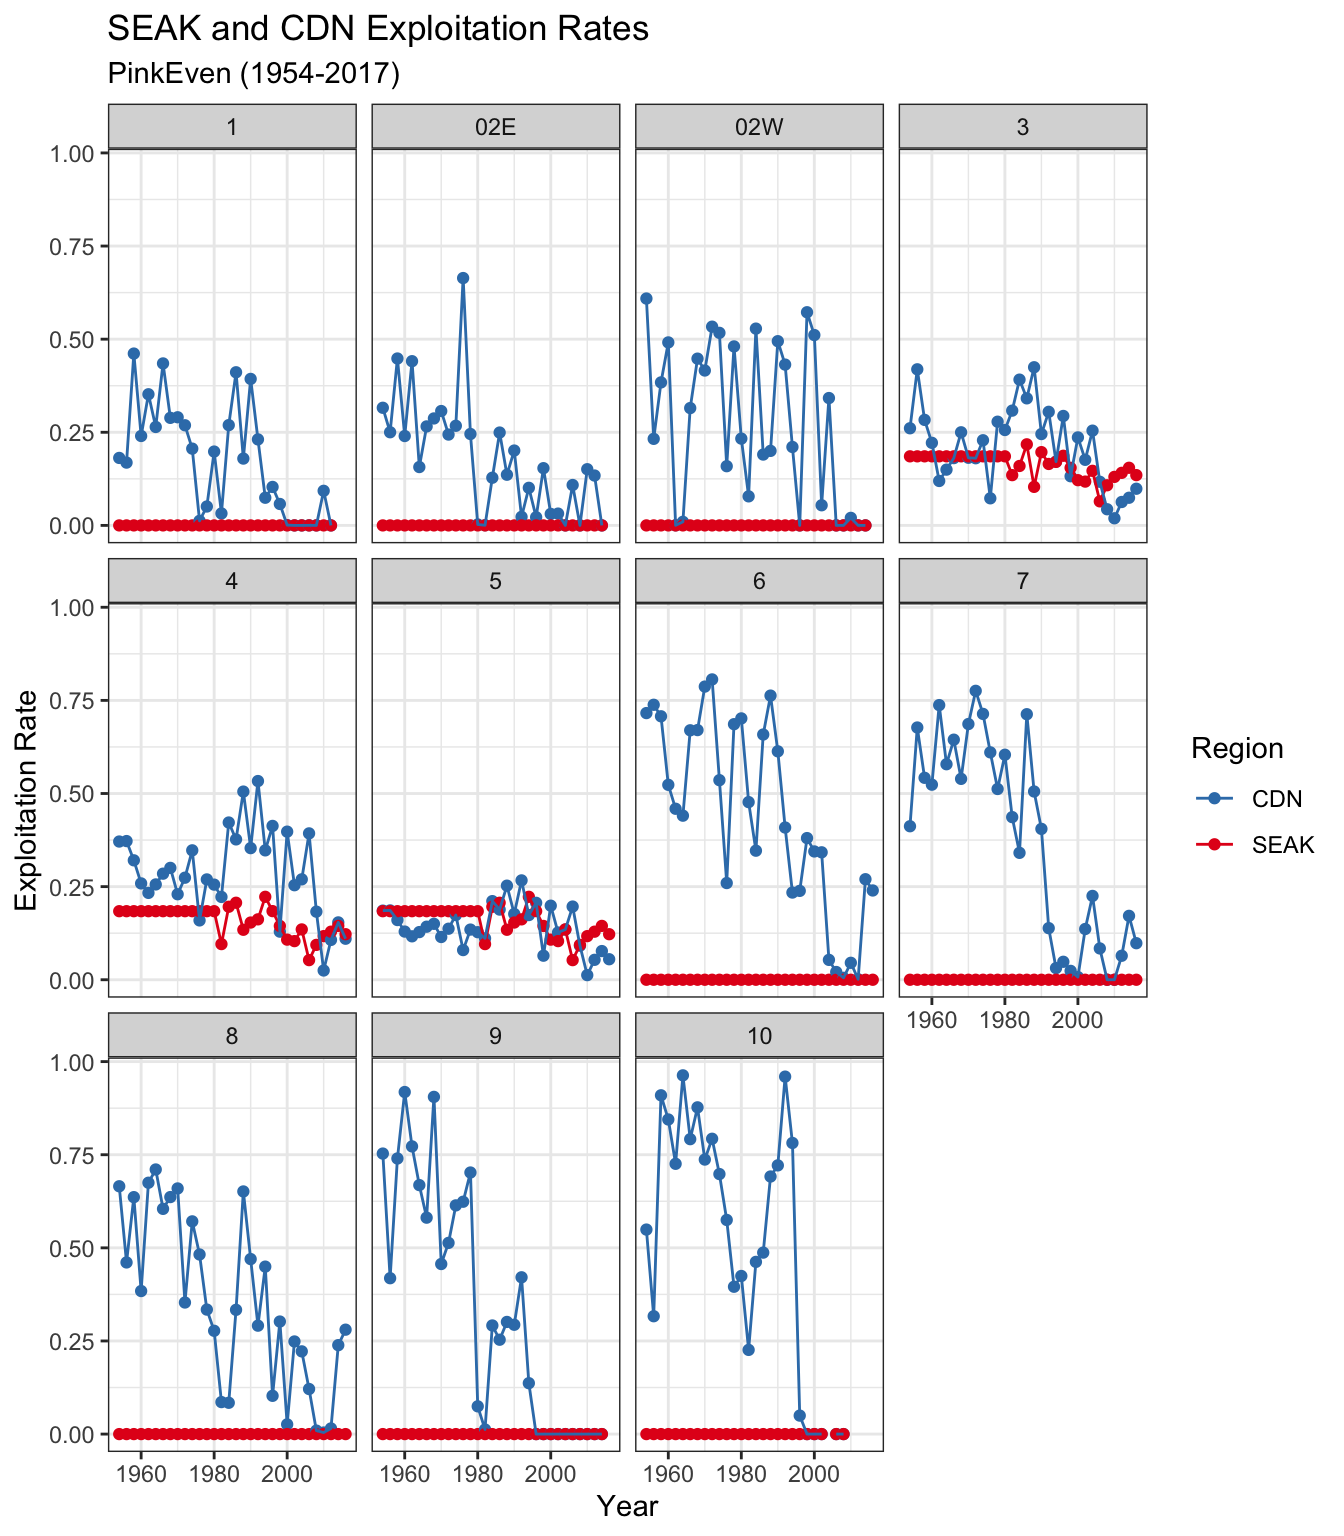
SSEAK and Canadian exploitation rates for north and central coast BC even year pink salmon are shown in Figure 38. Exploitation rates from SSEAK are only estimated for Areas 3, 4 and 5. Canadian exploitation rates have declined to much lower levels than in historical time period in all Areas (except Area 9 and 10 where recent estimates are not available). SSEAK exploitation rates have declined slightly since the 80s, but in the last 20 years have averaged around 12% in Areas 3,4 and 5.
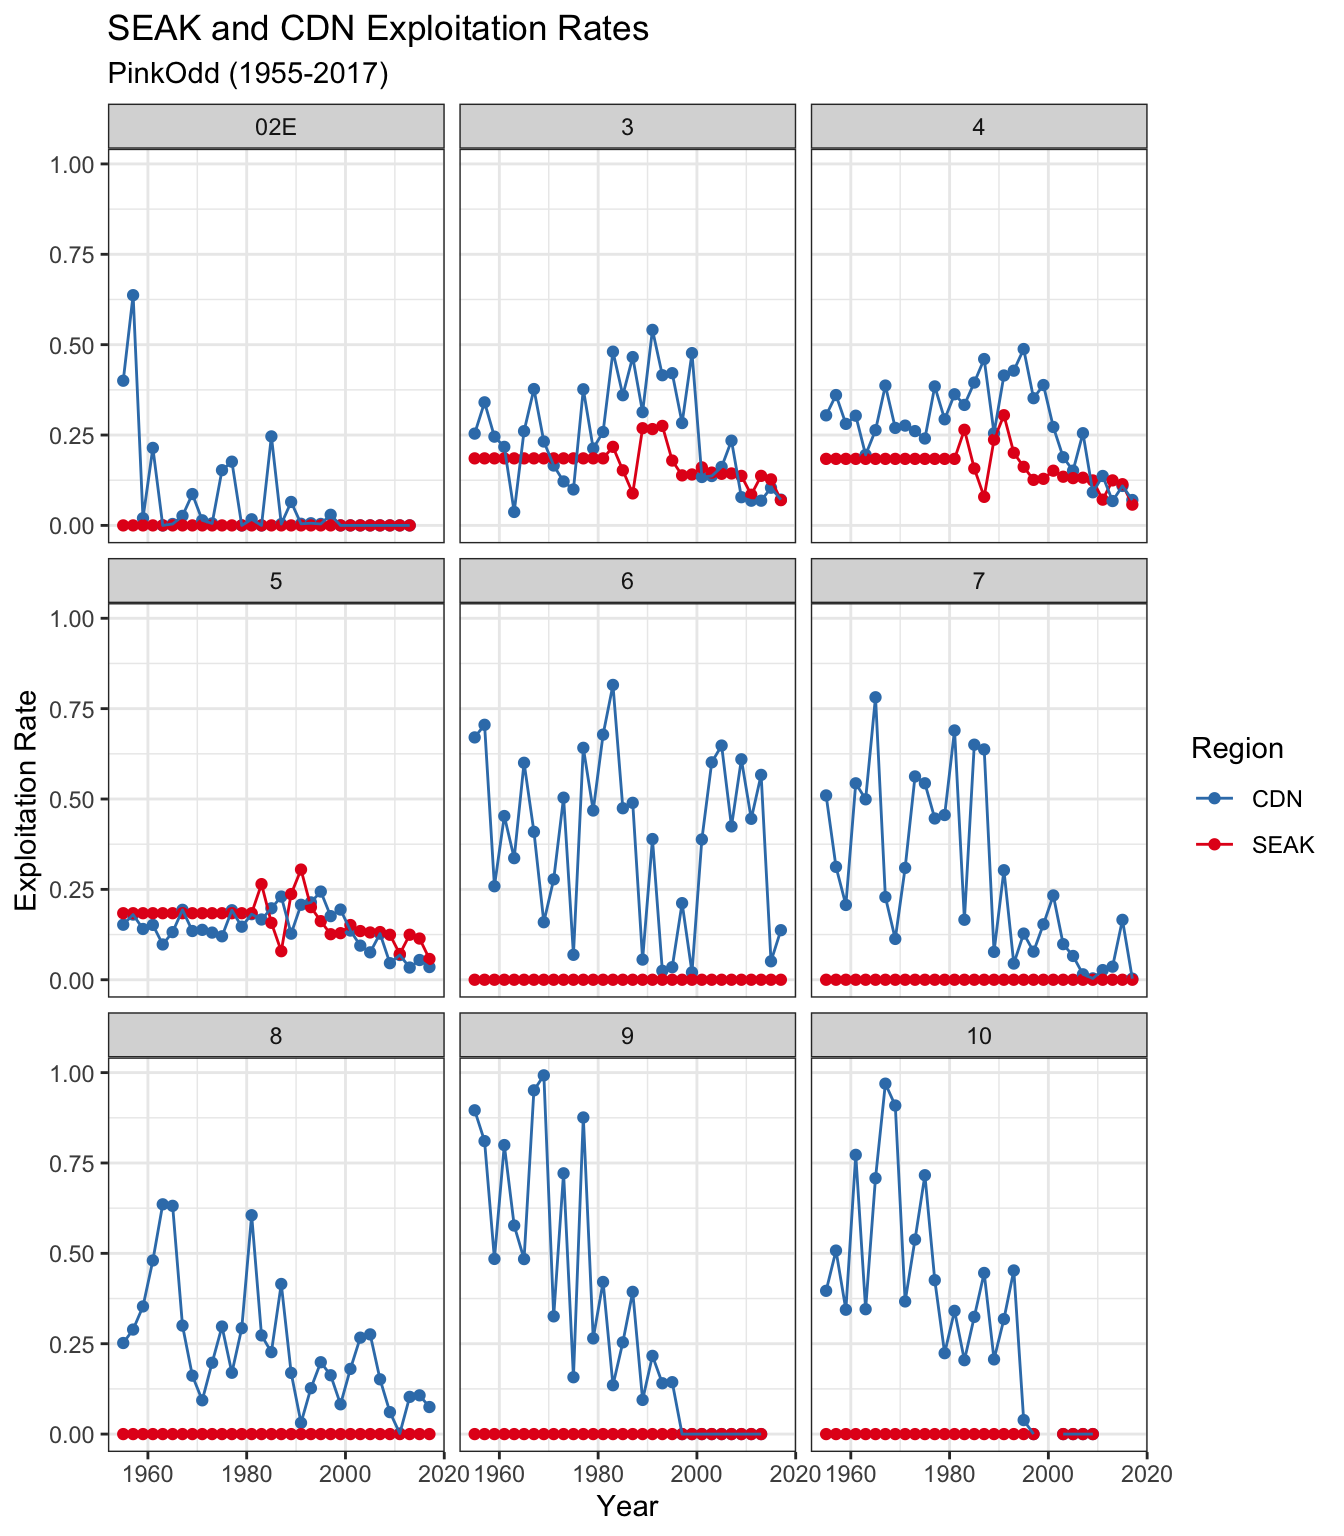
SSEAK and Canadian exploitation rates for north and central coast BC odd year pink salmon are shown in Figure 39. Exploitation rates from SSEAK are only estimated for Areas 3, 4 and 5. Similar to even year pink salmon, Canadian exploitation rates have declined to much lower levels than in historical time period in all Areas (except Area 9 and 10 where recent estimates are not available). SSEAK exploitation rates have declined slightly since the 80s, but in the last 20 years have averaged around 10% in Areas 3,4 and 5.
SSEAK exploitation rates are shown for north and central coast CUs by year for even and odd year pink salmon in Figure 40. Similar to the Area specific exploitation rates these are estimated from, SSEAK exploitation rates decline starting around 1990 in most CUs. Recent year CUs range from ~ 10-15% for most CUs, and ~ 2.5% for the even-year Hecate Lowlands and odd-year Hecate Strait-Lowlands CUs.
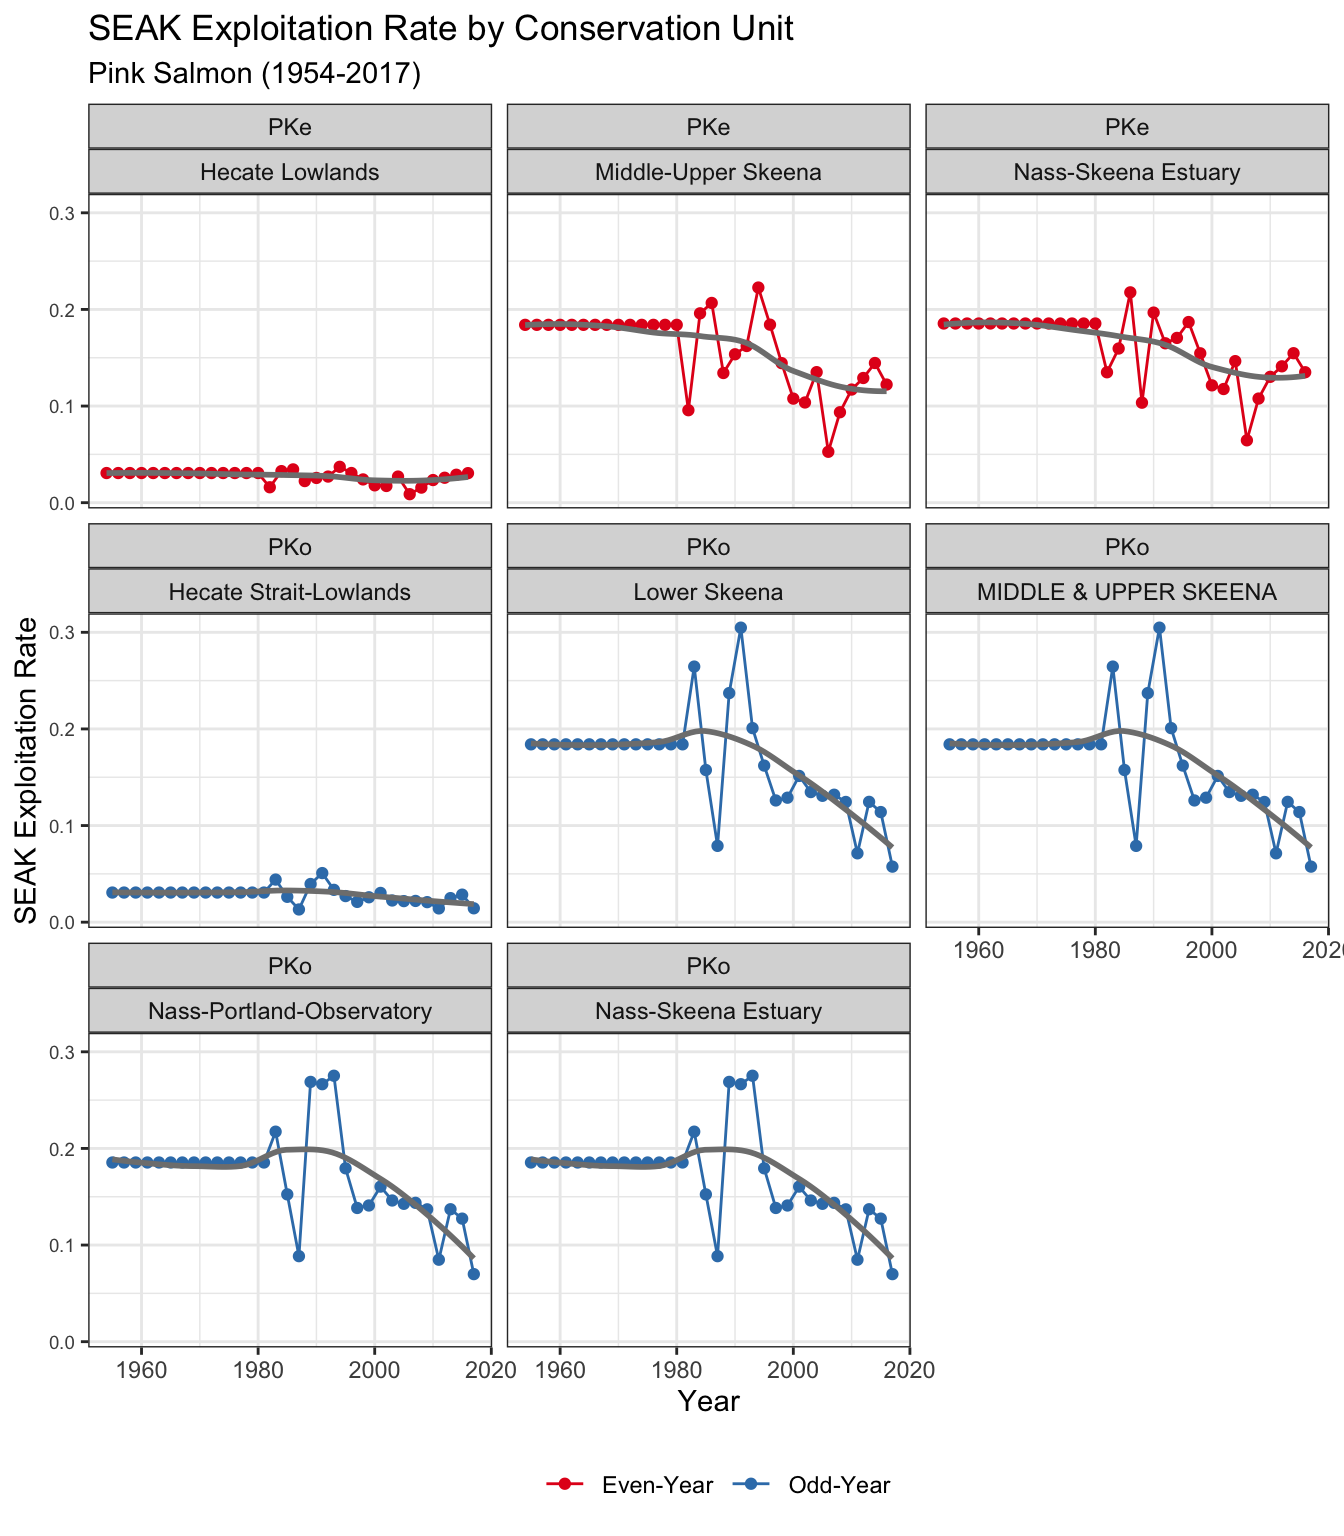
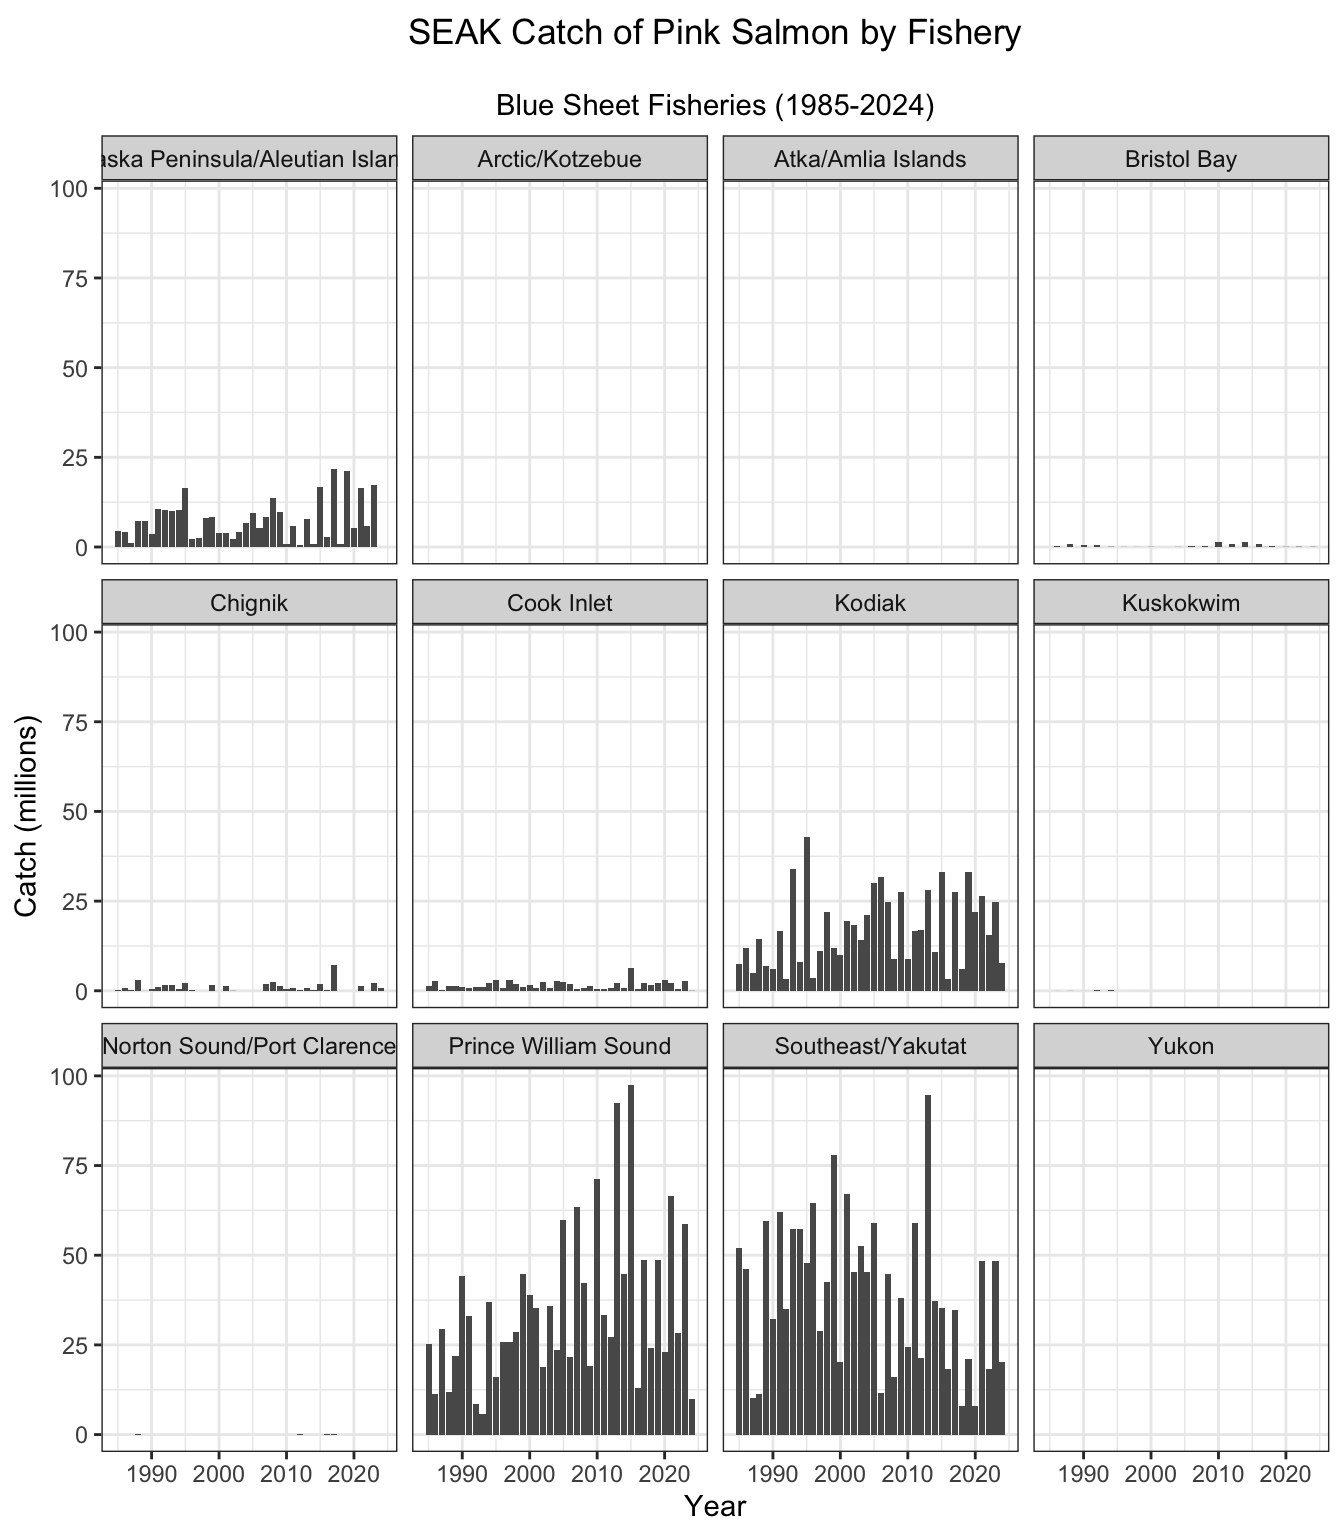
Figure 41 shows the harvest of pink salmon by “Blue Sheet” fishery for 1979-2024. Pink salmon are primarily caught in the Southeast/Yakutat, Prince William Sound, Kodiak, and Alaska Peninsula/Aleutian Islands fisheries, as well as Cook Inlet and Chignik fisheries, and a very small number in Bristol Bay.
Transboundary
Steelhead
To be added.